6
$\begingroup$

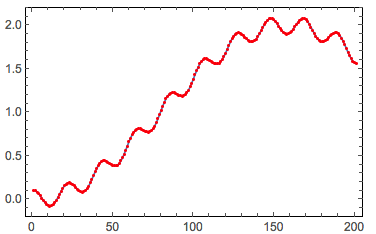
I have a signal that I want to identify the frequencies in it, I used the Fourier function but I can't get the frequency correctly. Here is a simplified example:

dt = 1/100;
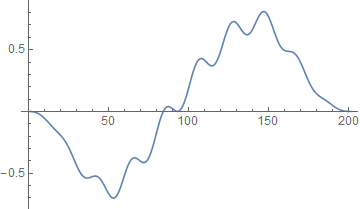
ls = Table[0.1 Cos[30 x] + 2 Sin[x]^2, {x, 0, 200 dt, dt}];
ListPlot[ls, Mesh -> All, MeshStyle -> Red]
enter image description here

and the Fourier transform

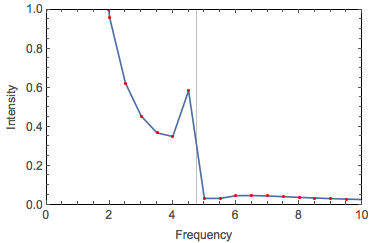
ListPlot[Abs[Fourier[ls]]^2, PlotRange -> {{0, 10}, {0, 1}}, 
 DataRange -> {0, 1/dt}, 
 FrameLabel -> {"Frequency", "Intensity"}, 
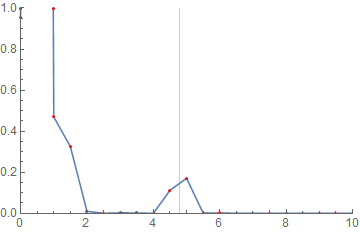
 Mesh -> All, MeshStyle -> Red, GridLines -> {{30/(2 π)}, None}]
enter image description here

Why do I get the peak not at the original frequency 30/(2Pi), but with a frequency shift? Did I make a terrible mistake? What's the correct way to recover the original frequency using Mathematica's signal processing features?

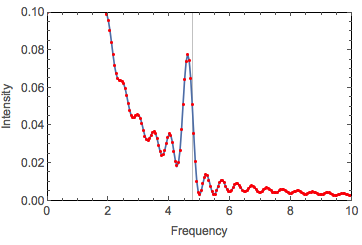
I tried to padding zeros but still have a frequency shift.

ListPlot[Abs[Fourier[PadRight[ls, 2000]]]^2, 
 PlotRange -> {{0, 10}, {0, .1}}, DataRange -> {0, 1/dt}, 
 FrameLabel -> {"Frequency", "Intensity"}, 
 Mesh -> All, MeshStyle -> Red, GridLines -> {{30/(2 π)}, None}]
enter image description here

Edit

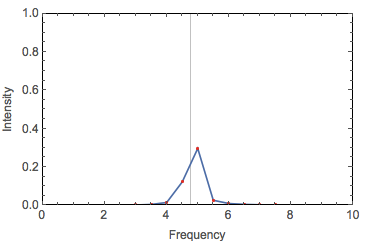
I'm still not convinced that this problem is due to that there are too few periods contains in the signal, nor that number of periods contained in the signal is not an integer. Consider this signal

ls = Table[0.1 Cos[30 x], {x, 0, 200 dt, dt}];

it contains the same number of periods and the number of periods is not an integer, it gives a peak that are not centered,

ListPlot[Abs[Fourier[ls]]^2, PlotRange -> {{0, 10}, {0, 1}}, 
 DataRange -> {0, 1/dt}, 
 FrameLabel -> {"Frequency", "Intensity"}, 
 Mesh -> All, MeshStyle -> Red, GridLines -> {{30/(2 π)}, None}]
enter image description here

but padding zero helps

ListPlot[Abs[Fourier[PadRight[ls, 2000]]]^2, 
 PlotRange -> {{0, 10}, {0, .1}}, DataRange -> {0, 1/dt}, 
 FrameLabel -> {"Frequency", "Intensity"}, 
 Mesh -> All, MeshStyle -> Red, GridLines -> {{30/(2 π)}, None}]
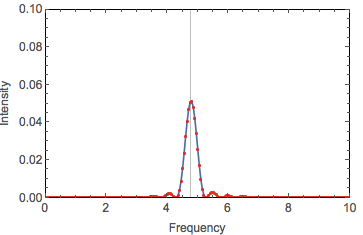
enter image description here

$\endgroup$
9
  • $\begingroup$ possible duplicate of Plotting the frequency spectrum of a data series using Fourier $\endgroup$
    – chuy
    Commented Jul 30, 2014 at 16:17
  • 1
    $\begingroup$ @chuy I don't think it's a duplicate, the post you linked is because of aliasing where the sample rate is not high enough to cover the signal frequency, here it's not. You can see that by comparing the plot of the data in that question to the first plot in this question. $\endgroup$ Commented Jul 30, 2014 at 17:52
  • 1
    $\begingroup$ When the waveform has very few periods, the magnitude of the Fourier transform depends on the phase of the Cos[30 x]. Try Cos[30 x + Pi] and you will see the peak above the expected frequency. $\endgroup$
    – andre314
    Commented Jul 30, 2014 at 18:00
  • $\begingroup$ @xslittlegrass, actually it was the second part in the answer: "in addition, the discrete fast Fourier transform assumes periodicity." $\endgroup$
    – chuy
    Commented Jul 30, 2014 at 18:19
  • 3
    $\begingroup$ You are sampling your squared sine less than a single period. This means that your spectrum will be samples of some deltas convolved with a fat Sinc (and the samples won't happen to fall on the sinc's zeros). Given that Sinc's fatness, the fact that your sin has high amplitude compared to the cos, that the cos frequency isn't very far away from the sin's (just about 9 sinc's lobes away), that the sinc decays slowly (compared to other common window transforms), that sinc's lobe is comparable to the cos's and makes it appear shifted $\endgroup$
    – Rojo
    Commented Jul 31, 2014 at 6:02

4 Answers 4

13
$\begingroup$

I believe the frequency mismatch arises because the endpoints of your 200 point series are offset. The first point has amplitude 0.1, the last 1.5584. As others mention, the Fourier transform assumes periodicity. So the signal you are transforming has a sine component, a cosine component, and a step function offset of the first and last points. The Fourier transform of a step function is

FourierTransform[UnitStep[t], t, x]

which evaluates to roughly $1/x+\delta[x]$, where $\delta$ is the delta function, and $x$ is the frequency variable. This spectrum is peaked at $x=0$ and drops off with increasing $|x|$. Thus, the time-domain step function contributes a sloping frequency spectrum to your frequency-domain delta-functions from the sine and cosine. The sloped spectrum increases the amplitudes of frequencies less than $30/(2\pi)$ more than the amplitudes of frequencies greater than $30/(2\pi)$.

If your signal were sampled with 297 points, the first and last points would be 0.1 and 0.100489. With the endpoints roughly matched, the spectrum peak is not shifted from the expected $30/(2\pi)$.

EDIT

1) You comment that the partial period only gives the finite peak width. With respect, you cannot ignore the frequency response of the step function inherent in your data. It is in the spectrum, period. The "Edit" example you give has a smaller step-function offset, so its influence is reduced.

Plot[Abs[FourierTransform[UnitStep[t], t, w]]^2, {w, -1, 1}]

2) As you say, in a "real situation" signals cannot always contain an integer number of periods. In practice, signals are tapered on both ends with, for example, a cosine-squared bell function to eliminate step-function artefacts. Thus, an integral number of periods is not required. When I taper your 200 point function with the following very rough function, the DFT amplitudes at the sampled frequencies on either side of $f=30/(2\pi)$ are much more equal.

Block[{dt=1/100, ls, a=0.2, nn=201},
   ls = Table[0.1 Cos[30 x], {x, 0, 200 dt, dt}];
   ls = ls * Table[(1 - a)/2 - 1/2 Cos[2 \[Pi] n/(nn - 1)] + 
                   a/2 Cos[4 \[Pi] n/(nn - 1)], {n, 0, 200}];
   ListPlot[Abs[Fourier[PadRight[ls,2000]]]^2, 
      PlotRange->{{0,10},{0,0.015}}, DataRange->{0, 1/dt}, 
      Joined->True, FrameLabel->{"Frequency","Intensity"}, 
      Mesh->All, MeshStyle->Red, GridLines->{{30/(2 \[Pi])},None}] ]

3) The DFT does what it does, and its answers are not "wrong"; however, its answers require some interpretation in light of limited data, non-integral periods, and mismatched endpoints. (Thank you @LeoFang)

$\endgroup$
9
  • $\begingroup$ I think partial period in the signal only gives the finite width of the peak, see my comments under my question and the other answer. Moreover, if this is because of the partial period, how can I explain that the signal in my "Edit" gives the correct frequency after padding zeros? Its end point is also not perfectly lined up. Plus, in a real situation, it's difficult to ensure the restriction that every signal should contain integer number of periods. Does that mean Fourier transform always give "wrong" results in identifying the frequencies? $\endgroup$ Commented Jul 30, 2014 at 23:11
  • $\begingroup$ That makes perfect sense. Thanks a lot! $\endgroup$ Commented Jul 31, 2014 at 3:44
  • $\begingroup$ Kenny, I'm sorry to give you a downvote but I think your explanation is wrong. @xslittlegrass, please take a look again at both James Cunnane's and my answers below. In my answer I did capture the two frequencies 2/2Pi (not 1/2Pi because it's sine square) and 30/2Pi without any shift if you further increase duration from Pi to 10Pi. $\endgroup$
    – Leo Fang
    Commented Jul 31, 2014 at 18:43
  • $\begingroup$ @LeoFang I guess maybe your are saying the same thing. Half of a cycle of the low frequency in the signal gives a step function, which creates spectrum that interfere with the high frequency peak. I upvoted your answer too :) $\endgroup$ Commented Aug 1, 2014 at 1:39
  • $\begingroup$ @LeoFang I'm sorry about your downvote too, especially since you do not say how or why my explanation is wrong. I will not downvote your answer, you could do that yourself because both our explanations are the same, as stated by xslittlegrass in the comment above. You and I both suggest sampling more points to solve the problem. In my case 297 points, in yours 314, a trivial difference caused by the low-amplitude higher-frequency component. Can you see that, for harmonic signals, an incomplete period is the same as mismatched endpoint amplitudes? $\endgroup$ Commented Aug 7, 2014 at 13:49
10
$\begingroup$

Fourier Transform is based on assumptions of periodicity related to the duration of the data. If you choose a misleading duration, you will get misleading results.

The duration (200 dt) of your array ls is not a multiple of the periods of your waveforms; this introduces artefacts arising from the Fourier transform of the 'top hat' function of width (200 dt). No amount of padding will remove this completely.

Try with the duration of ls much closer to a multiple of the duration of the fundamental; results will be closer to expected.

A dramatic improvement is seen with 314 points, i.e. about 100 times \Pi

$\endgroup$
10
  • $\begingroup$ I don't think it's because that the signal contains too few periods, see my update. $\endgroup$ Commented Jul 30, 2014 at 19:00
  • 3
    $\begingroup$ @xslittlegrass I think it's not your periods are too few, it's because the total duration of your data ($L$) is not exactly an integer multiple of the duration of one period of the signal ($T$). $L/T \notin \mathbb N$ $\endgroup$
    – Silvia
    Commented Jul 30, 2014 at 19:48
  • 1
    $\begingroup$ @xslittlegrass, I deleted my misleading comment. A more precise explanation is that you have to fine-tune your duration T (in this case, 200dt) such that an integer multiple of 1/T exactly locates at the frequency you're looking at (in this case, 30/2Pi) in the Fourier spectrum, otherwise the "energy" would be split into adjacent frequencies, which can be seen by simply increasing T to an arbitrary value (so that you have finer grid in the spectrum). $\endgroup$
    – Leo Fang
    Commented Jul 30, 2014 at 20:04
  • $\begingroup$ @Silvia Leo Fang I think L/T is not an integer only gives the finite width of the peak, but not a frequency shift. For the signal in my update, that ratio is also not an integer, but the the frequency in the spectrum is correct. $\endgroup$ Commented Jul 30, 2014 at 20:11
  • 1
    $\begingroup$ And furthermore: You would do even better by also preprocessing the original data to remove offset and linear trend; this gets rid of the discontinuity effects noted by @KennyColnago. But need to be careful if you are doing frame-based Fourier Transform; don't throw away the per-frame offsets, as they contain information about frequencies below the lowest frequency discernible in a single frame. $\endgroup$ Commented Jul 31, 2014 at 20:48
4
$\begingroup$

A windowing function should help:

ls2 = (ls - Mean[ls]) Array[TukeyWindow, Length@ls, {{-0.5, 0.5}}];

ListLinePlot[ls2]

enter image description here

ListLinePlot[Abs[Fourier[ls2]]^2, PlotRange -> {{0, 10}, {0, 1}}, DataRange -> {0, 1/dt}, 
 FrameLabel -> {"Frequency", "Intensity"}, Mesh -> All, MeshStyle -> Red, 
 GridLines -> {{30/(2 π)}, None}]

enter image description here

$\endgroup$
1
3
$\begingroup$

This is just a long supplement comment to @James Cunnane's answer which is correct. Try

dt = 1/100;
T=Pi;
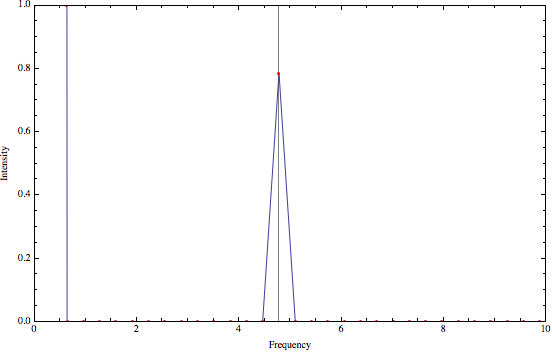
ls = Table[0.1 Cos[30 x] + 2 Sin[x]^2, {x, 0, T, dt}];
ListPlot[ls, Mesh -> All, MeshStyle -> Red]
ListPlot[Abs[Fourier[ls]]^2, PlotRange -> {{0, 10}, {0, 1}}, 
DataRange -> {0, 1/dt}, FrameLabel -> {"Frequency", "Intensity"}, 
Mesh -> All, MeshStyle -> Red, GridLines -> {{30/(2 \[Pi])}, None}, 
Frame -> True, Joined -> True]

output

Note the only thing changed is the duration T whose inverse (1/Pi) defines the grid size in the Fourier spectrum. As a result, the desired frequency 30/Pi is now an integer multiple of the grid size and therefore can be captured correctly.

EDIT

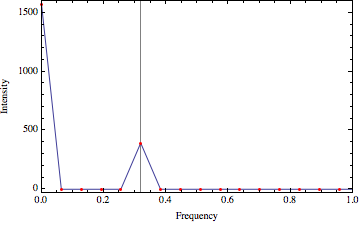
Because the grid size 1/T=1/Pi is not fine enough, it is less easier to observe the lower frequency 2/2Pi (not 1/Pi because it's a sine square). Try to increase T to a larger value would resolve this issue if you like:

dt = 1/100;
T = 5 Pi;
ls = Table[0.1 Cos[30 x] + 2 Sin[x]^2, {x, 0, T, dt}];
ListPlot[Abs[Fourier[ls]]^2, PlotRange -> {{0, 1}, All}, 
DataRange -> {0, 1/dt}, FrameLabel -> {"Frequency", "Intensity"}, 
Mesh -> All, MeshStyle -> Red, GridLines -> {{2/(2 \[Pi])}, None}, 
Frame -> True, Joined -> True]

output2

Last comment: The reason you see a very high peak at zero frequency is due to the constant term when you write Sin[x]^2 as (1 - Cos[2 x])/2.

$\endgroup$

Your Answer

By clicking “Post Your Answer”, you agree to our terms of service and acknowledge you have read our privacy policy.

Not the answer you're looking for? Browse other questions tagged or ask your own question.