13
$\begingroup$

Note: this is fixed in version 9.


My question concerns the usage of NExpectation and Expectation and why I see the behavior I see in the following example.

First take some data and derive an EmpiricalDistribution:

data = {4, 104, 96, 80, 22, 76, 106, 18, 98, 44, 112, 78, 50, 120, 2, 6, 
        100, 10, 68, 80, 42, 66, 100, 58, 4, 76, 18, 102, 6, 16, 52, 32, 62, 
        36, 18, 4, 54, 98, 38, 74, 16, 22, 102, 2, 2, 4, 22, 72, 100, 82, 48, 
        16, 34, 44, 130, 50, 48, 74, 60, 96, 8, 118, 30, 58, 84, 4, 70, 66, 
        40, 14, 92, 68, 42, 56, 56, 16, 40, 12, 22, 26, 98, 4, 80, 100, 36, 
        88, 48, 26, 28, 94, 22, 26, 78, 16, 52, 8, 10, 2};

dist = EmpiricalDistribution[data];

You can plot PDFs and CDFs of the distribution:

Row[{DiscretePlot[PDF[dist, x], {x, data}, Joined -> True, ImageSize -> 300], 
     DiscretePlot[CDF[dist, x], {x, 0, Max@data, 1}, Joined -> True, ImageSize -> 300]}]

They look like this:
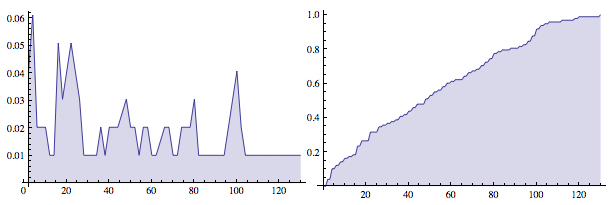
PDF & CDF plots

That covers the background. Now execute the following and it gets a little odd:

Expectation[X \[Conditioned] X > 4, X \[Distributed] dist]
NExpectation[X \[Conditioned] X > 4, X \[Distributed] dist]
N[Expectation[X \[Conditioned] X > 4, X \[Distributed] dist]]

620/11
NExpectation[X \[Conditioned] X > 4, X \[Distributed]DataDistribution[<<"Empirical">>, {51}]]
56.3636

So, what gives?

How come NExpectation[...] doesn't calculate an answer, but N[Expectation[...]] does? Clearly, Expectation handles EmpiricalDistribution without a problem. One would think that NExpectation would as well. Doesn't this seem odd? Just hoping that understanding why Mathematica does this might yield additional insights into Mathematica itself.

$\endgroup$
4
  • $\begingroup$ That is weird. I think it might be a bug, because using HistogramDistribution works as expected in all 3 cases. $\endgroup$
    – rm -rf
    Commented May 10, 2012 at 20:56
  • 1
    $\begingroup$ I guess you may add this to my Distributions bug list. $\endgroup$ Commented May 10, 2012 at 20:59
  • $\begingroup$ I wonder if somehow the equivalent of a tag set for NExpectation with EmpiricalDistribution got overlooked in its definition. $\endgroup$
    – Jagra
    Commented May 10, 2012 at 21:26
  • $\begingroup$ @Jagra Look at the TracePrint of NExpectation. For a kernel function it's extremely verbose. $\endgroup$ Commented May 10, 2012 at 22:10

1 Answer 1

11
$\begingroup$

This isn't perhaps exactly what you are looking for but here are some points worth noting.

In version 8 NExpectation uses numerical integration and summation methods whereas N[Expectation[...]] uses direct integration or summation and then approximates numerically after the fact.

Though the idea is for data-distributions in M to behave just like regular distributions they are very different creatures under the hood. EmpiricalDistribution is perhaps the most different in that it is hard to categorize as discrete or continuous (whereas something like HistogramDistribution or SmoothKernelDistribution is continuous).

Taking both of these into consideration, general NExpectation methods won't work for EmpiricalDistribution directly out of the box. Expectations for EmpiricalDistribution are computed in the same way as those for raw lists of data. For example...

Expectation[f[x], x \[Distributed] Range[10]] == Expectation[f[x], 
   x \[Distributed]EmpiricalDistribution[Range[10]]]

==> True

This is effectively accomplished by simply mapping the function f over the list and taking the mean.

In my opinion there isn't a very good reason not to have a special case for NExpectation[EmpiricalDistribution[...]] that is effectively N[Expectation[EmpiricalDistribution[...]]]. It just isn't there in 8.

$\endgroup$
0

Your Answer

By clicking “Post Your Answer”, you agree to our terms of service and acknowledge you have read our privacy policy.

Not the answer you're looking for? Browse other questions tagged or ask your own question.