4
$\begingroup$

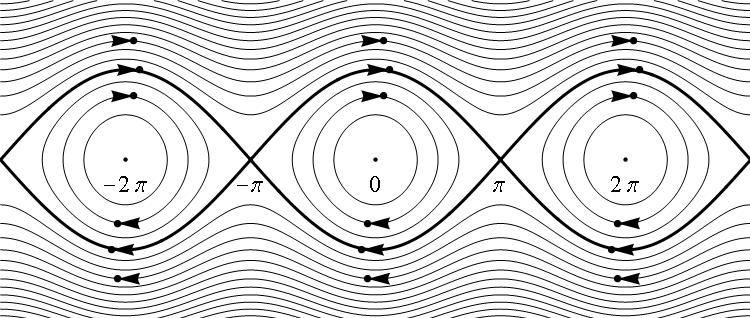
I am trying to create an illustration for a paper and export it to PDF. Here is the code

textsize = 16;
Framed[Show[
  ContourPlot[y^2 - Cos[x], {x, -3 Pi, 3 Pi}, {y, -2.5, 2.5}, 
  ContourShading -> None, ContourStyle -> Thickness[0.002], 
PlotPoints -> 100, Frame -> None, Contours -> Range[-1, 7, 0.5], 
AspectRatio -> 4/(3 Pi), PlotRangePadding -> 0],

ContourPlot[y^2 - Cos[x] == 1, {x, -3 Pi, 3 Pi}, {y, -2.5, 2.5}, 
ContourShading -> None, ContourStyle -> Thickness[0.004], 
PlotPoints -> 200, Frame -> None, AspectRatio -> 4/(3 Pi), 
PlotRangePadding -> 0],

Graphics[{Black, Arrowheads[0.025], PointSize[0.0001], 
Thickness[0.0001], 
Arrow[#] & /@ {{{0.0, Sqrt[2]}, {0.35, 
    Sqrt[2]}}, {{-0.1, -Sqrt[2]}, {-0.35, -Sqrt[2]}}, {{2 Pi + 
     0.1, Sqrt[2]}, {2 Pi + 0.35, 
    Sqrt[2]}}, {{2 Pi - 0.1, -Sqrt[2]}, {2 Pi - 
     0.35, -Sqrt[2]}}, {{-2 Pi + 0.1, Sqrt[2]}, {-2 Pi + 0.35, 
    Sqrt[2]}}, {{-2 Pi - 0.1, -Sqrt[2]}, {-2 Pi - 
     0.35, -Sqrt[2]}}},
  Arrowheads[0.015], 
  Arrow[#] & /@  {{{0, 1}, {0.2, 
    1}}, {{-0, -1}, {-0.2, -1}}, {{2 Pi + 0.1, 1}, {2 Pi + 0.2, 
    1}}, {{2 Pi - 0.1, -1}, {2 Pi - 0.2, -1}}, {{-2 Pi + 0.1, 
    1}, {-2 Pi + 0.2, 1}}, {{-2 Pi - 0.1, -1}, {-2 Pi - 0.2, -1}}},
 Arrow[#] & /@  {{{0.1, 1.87}, {0.2, 
    1.87}}, {{-0.1, -1.87}, {-0.2, -1.87}}, {{2 Pi + 0.1, 
    1.87}, {2 Pi + 0.2, 
    1.87}}, {{2 Pi - 0.1, -1.87}, {2 Pi - 0.2, -1.87}}, {{-2 Pi + 
     0.1, 1.87}, {-2 Pi + 0.2, 
    1.87}}, {{-2 Pi - 0.1, -1.87}, {-2 Pi - 0.2, -1.87}}}    }],
Graphics[
Point[#] & /@ {{0, 0}, {Pi, 0}, {-Pi, 0}, {2 Pi, 0}, {-2 Pi, 0}}], 
Graphics[{Text[Style[0, textsize], {0, -0.4}], 
Text[Style[\[Pi], textsize], {Pi, -0.4}], 
Text[Style[-\[Pi], textsize], {-Pi, -0.4}], 
Text[Style[2 \[Pi], textsize], {2 Pi, -0.4}], 
Text[Style[-2 \[Pi], textsize], {-2 Pi, -0.4}]}], 
ImageSize -> 500]]

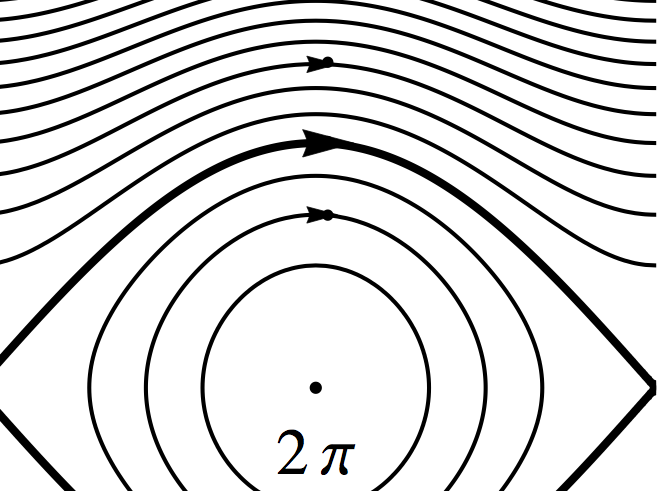
Then I use Export[...,%] on the result to create the PDF. Here is a part of it:
enter image description here

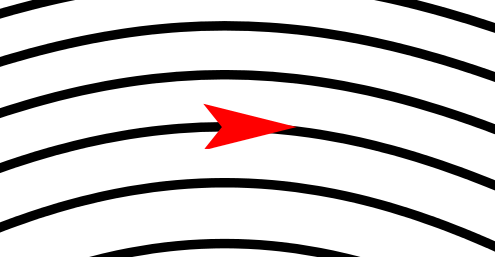
So, what's up with the little dots at the tips of the arrows? They are not visible in Mathematica and their size does not decrease if I decrease Arrowheads. They only solution I have found so far is take Imagesize->1000 and then downscale the image in latex, which is not ideal because I need to control the line width across all images.


In short the problem can be reduced to:

Graphics[{[email protected], Arrow[{{-2 Pi - 0.1, -1}, {-2 Pi - 0.2, -1}}]}, 
  AspectRatio -> 4/(3 Pi), PlotRangePadding -> 0, 
  PlotRange -> {{-3 Pi, 3 Pi}, {-2.5, 2.5}}]

enter image description here

$\endgroup$
4
  • $\begingroup$ I changed quite everything in order to show the one and only problem. Feel free to revert the changes if you are unhappy with this. $\endgroup$
    – Öskå
    Commented Jul 3, 2014 at 13:51
  • $\begingroup$ @Öskå yeah, that's obviously better, thank you. I wanted also to point out the fact that the position of a circle with respect to the arrow tip is not fixed -- they kind of "jump around" the arrow heads randomly. $\endgroup$ Commented Jul 3, 2014 at 13:54
  • $\begingroup$ In short your problem is that you want just the arrow head at the position {x,y}. $\endgroup$
    – Öskå
    Commented Jul 3, 2014 at 14:04
  • $\begingroup$ @Öskå Apparently. But how else can I create an arrow with zero length but without creating a custom arrow head shape and rotating it? And this still looks like a bug because the circles are not visible in Mathematica. $\endgroup$ Commented Jul 3, 2014 at 14:06

2 Answers 2

4
$\begingroup$

So what you basically have to do is to take the head of the arrow only. I was a bit lazy to rebuild the Polygon myself so I looked for a .m file related to Arrow and found Arrow.m in /usr/local/Wolfram/Mathematica/8.0/AddOns/LegacyPackages/Graphics which contains approximately the following function makehead:

makehead[len_, wid_, cent_] := Polygon@{{0, 0}, {-len, (len*wid)/2}, {-(len*cent), 0}, 
                                        {-len, -(len*wid)/2}, {0, 0}}
arrow[pt_, size_, col_] := 
  Inset[Graphics[{col, makehead[Sign@Last@pt, .5, .8]}], pt, Center, Scaled@size]

I just took a few points from your question:

pts = {{{0.1, 1.87}, {0.2, 1.87}}, {{-0.1, -1.87}, {-0.2, -1.87}}, 
       {{2 Pi + 0.1, 1.87}, {2 Pi + 0.2, 1.87}}, {{2 Pi - 0.1, -1.87}, {2 Pi - 0.2, -1.87}}, 
       {{-2 Pi + 0.1, 1.87}, {-2 Pi + 0.2, 1.87}}, {{-2 Pi - 0.1, -1.87}, {-2 Pi - 0.2, -1.87}}};

Framed[Show[
  ContourPlot[y^2 - Cos[x], {x, -3 Pi, 3 Pi}, {y, -2.5, 2.5}, 
   ContourShading -> None, ContourStyle -> Thickness[0.002], 
   PlotPoints -> 100, Frame -> None, Contours -> Range[-1, 7, 0.5], 
   AspectRatio -> 4/(3 Pi), PlotRangePadding -> 0, 
   Epilog -> (arrow[#, 0.025, Red] & /@ pts[[All, 1]])], 
  ContourPlot[y^2 - Cos[x] == 1, {x, -3 Pi, 3 Pi}, {y, -2.5, 2.5},
    ContourShading -> None, ContourStyle -> Thickness[0.004], 
    PlotPoints -> 200, Frame -> None, AspectRatio -> 4/(3 Pi), 
    PlotRangePadding -> 0], ImageSize -> 700]]

Giving this on Mathematica:

Mathematica graphics

and the following in PDF:

enter image description here

$\endgroup$
2
  • $\begingroup$ Well, this is a solution :) $\endgroup$ Commented Jul 3, 2014 at 19:04
  • $\begingroup$ @level1807 Well, that's the only thing I could think of :) You can also build the Polygon in terms of the position of the centre but that's more complicated than just using Inset to place it wherever you want :) $\endgroup$
    – Öskå
    Commented Jul 3, 2014 at 19:15
1
$\begingroup$

If you need to show the points at the arrow tips, you should specify them separately from the specification of the arrows. The points coordinates may be obtained from those of the arrows. Try this:

     textsize = 16;
ah = 0.03;
ps1 = 0.5;
ps2 = 0.01;
lstAr1 = {{{0.0, Sqrt[2]}, {0.35, 
     Sqrt[2]}}, {{-0.1, -Sqrt[2]}, {-0.35, -Sqrt[2]}}, {{2 Pi + 0.1, 
     Sqrt[2]}, {2 Pi + 0.35, 
     Sqrt[2]}}, {{2 Pi - 0.1, -Sqrt[2]}, {2 Pi - 
      0.35, -Sqrt[2]}}, {{-2 Pi + 0.1, Sqrt[2]}, {-2 Pi + 0.35, 
     Sqrt[2]}}, {{-2 Pi - 0.1, -Sqrt[2]}, {-2 Pi - 0.35, -Sqrt[2]}}};
lstAr2 = {{{0, 1}, {0.2, 1}}, {{-0, -1}, {-0.2, -1}}, {{2 Pi + 0.1, 
     1}, {2 Pi + 0.2, 
     1}}, {{2 Pi - 0.1, -1}, {2 Pi - 0.2, -1}}, {{-2 Pi + 0.1, 
     1}, {-2 Pi + 0.2, 1}}, {{-2 Pi - 0.1, -1}, {-2 Pi - 0.2, -1}}};
lstAr3 = {{{0.1, 1.87}, {0.2, 
     1.87}}, {{-0.1, -1.87}, {-0.2, -1.87}}, {{2 Pi + 0.1, 
     1.87}, {2 Pi + 0.2, 
     1.87}}, {{2 Pi - 0.1, -1.87}, {2 Pi - 0.2, -1.87}}, {{-2 Pi + 
      0.1, 1.87}, {-2 Pi + 0.2, 
     1.87}}, {{-2 Pi - 0.1, -1.87}, {-2 Pi - 0.2, -1.87}}};

Framed[Show[
  ContourPlot[y^2 - Cos[x], {x, -3 Pi, 3 Pi}, {y, -2.5, 2.5}, 
   ContourShading -> None, ContourStyle -> Thickness[0.002], 
   PlotPoints -> 100, Frame -> None, Contours -> Range[-1, 7, 0.5], 
   AspectRatio -> 4/(3 Pi), PlotRangePadding -> 0], 
  ContourPlot[y^2 - Cos[x] == 1, {x, -3 Pi, 3 Pi}, {y, -2.5, 2.5}, 
   ContourShading -> None, ContourStyle -> Thickness[0.004], 
   PlotPoints -> 200, Frame -> None, AspectRatio -> 4/(3 Pi), 
   PlotRangePadding -> 0],

  Graphics[{Black, Arrowheads[ah], Thickness[0.0001], 
    Arrow[#] & /@ lstAr1, Arrow[#] & /@ lstAr2, 
    Arrow[#] & /@ lstAr3}], 
  Graphics[Append[
    Point[#] & /@ {{0, 0}, {Pi, 0}, {-Pi, 0}, {2 Pi, 0}, {-2 Pi, 0}}, 
    PointSize[ps1]]],

  Graphics[{PointSize[ps2], 
    Point[#] & /@ (Join[lstAr1, lstAr2, lstAr3] /. {x_, y_} -> y)}], 
  Graphics[{Text[Style[0, textsize], {0, -0.4}], 
    Text[Style[\[Pi], textsize], {Pi, -0.4}], 
    Text[Style[-\[Pi], textsize], {-Pi, -0.4}], 
    Text[Style[2 \[Pi], textsize], {2 Pi, -0.4}], 
    Text[Style[-2 \[Pi], textsize], {-2 Pi, -0.4}]}], 
  ImageSize -> 500]]

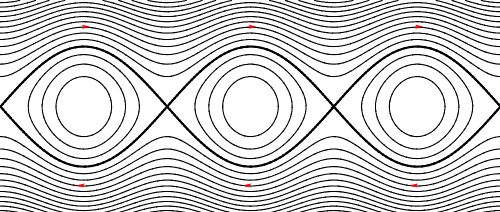
yielding the following: enter image description here Here ah specifies the arrow heads size, ps1 - specifies the points sizes in the centers of the cycles and ps2 - those at the arrow tips. I tried to save it as PDF and it works.
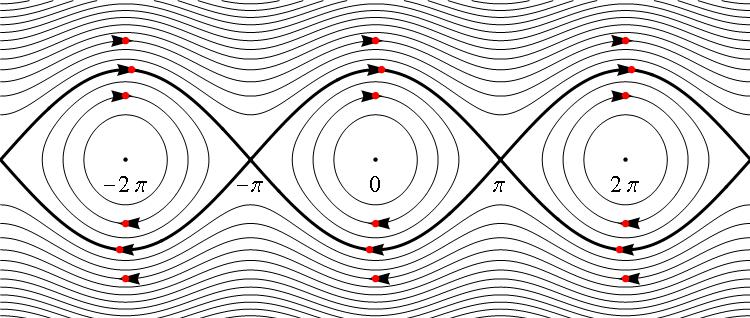
If you need that the points somewhat overlay the arrow tips, try this and play with the value of the parameter eps:

eps = 0.2;        
Framed[Show[
      ContourPlot[y^2 - Cos[x], {x, -3 Pi, 3 Pi}, {y, -2.5, 2.5}, 
       ContourShading -> None, ContourStyle -> Thickness[0.002], 
       PlotPoints -> 100, Frame -> None, Contours -> Range[-1, 7, 0.5], 
       AspectRatio -> 4/(3 Pi), PlotRangePadding -> 0], 
      ContourPlot[y^2 - Cos[x] == 1, {x, -3 Pi, 3 Pi}, {y, -2.5, 2.5}, 
       ContourShading -> None, ContourStyle -> Thickness[0.004], 
       PlotPoints -> 200, Frame -> None, AspectRatio -> 4/(3 Pi), 
       PlotRangePadding -> 0],

      Graphics[{Black, Arrowheads[ah], Thickness[0.0001], 
        Arrow[#] & /@ lstAr1, Arrow[#] & /@ lstAr2, 
        Arrow[#] & /@ lstAr3}], 
      Graphics[Append[
        Point[#] & /@ {{0, 0}, {Pi, 0}, {-Pi, 0}, {2 Pi, 0}, {-2 Pi, 0}}, 
        PointSize[ps1]]],

      Graphics[{Red, PointSize[ps2], 
        Point[#] & /@ (Join[lstAr1, lstAr2, lstAr3] /. {x_, y_} -> 
             y /. {x_, y_} -> If[y > 0, {x - eps, y}, {x + eps, y}])}], 
      Graphics[{Text[Style[0, textsize], {0, -0.4}], 
        Text[Style[\[Pi], textsize], {Pi, -0.4}], 
        Text[Style[-\[Pi], textsize], {-Pi, -0.4}], 
        Text[Style[2 \[Pi], textsize], {2 Pi, -0.4}], 
        Text[Style[-2 \[Pi], textsize], {-2 Pi, -0.4}]}], 
      ImageSize -> 500]]

enter image description here

$\endgroup$

Your Answer

By clicking “Post Your Answer”, you agree to our terms of service and acknowledge you have read our privacy policy.

Not the answer you're looking for? Browse other questions tagged or ask your own question.