This question leads on from the recent question What are the standard colors for plots in Mathematica?
There it was determined that the default color palette used by Plot is equivalent to ColorData[1] (see the note at the end). This can be changed through the use of the option PlotStyle.
My question is how can we make, e.g., the default color palette be ColorData[3] and have this default survive manual changes to other aspects of the plot styling?
So, for example, let's make a list of monomials and some dashing settings
fns = Table[x^n, {n, 0, 5}];
dash = Table[AbsoluteDashing[i], {i, 1, 6}];
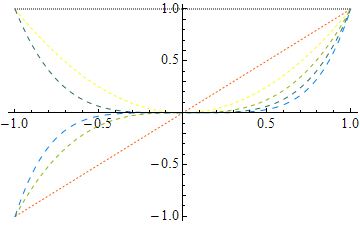
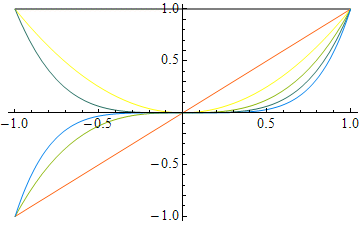
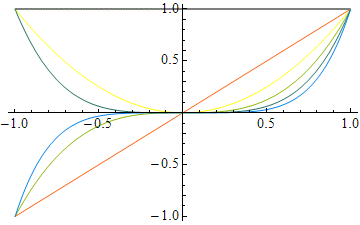
Note that the default plot colors survive other choices to styling:
GraphicsRow[{Plot[fns, {x, -1, 1}], Plot[fns, {x, -1, 1}, PlotStyle -> dash]}]

The colors in the plot may be changed by locally setting PlotStyle, such as
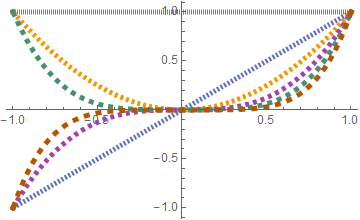
Plot[fns, {x, -1, 1}, PlotStyle -> ColorData[3, "ColorList"]]
or by setting the default options. Let's do that and run the GraphicsRow command again:
SetOptions[Plot, PlotStyle -> ColorData[3, "ColorList"]];
GraphicsRow[{Plot[fns, {x, -1, 1}], Plot[fns, {x, -1, 1}, PlotStyle -> dash]}]

Note that the new colors in the default plot style is overwritten by the use of PlotStyle -> dash. This can be manually fixed, in this case, with Transpose[{dash, ColorData[3, "ColorList"][[1 ;; 6]]}], but you don't want to do that every time.
Changing the default PlotStyle will always have this problem.
You'd expect there to be a default ColorData or color scheme setting somewhere,
but I have been unable to find it.
Note that running the hack
Unprotect[ColorData];
ColorData[1] := ColorData[3]
ColorData[1, a__] := ColorData[3, a]
Protect[ColorData];
does not fix the default plot colors.
Which probably means that the default internals of Plot does not make an explicit call to ColorData...
It's also interesting to note that when running a Trace[Plot[...],TraceInternal -> True] the colors seem to appear out of nowhere! I looked at such a trace in trying to answer this recent SO question related to how Mathematica determines the number of lines and thus colors it needs in a plot.

