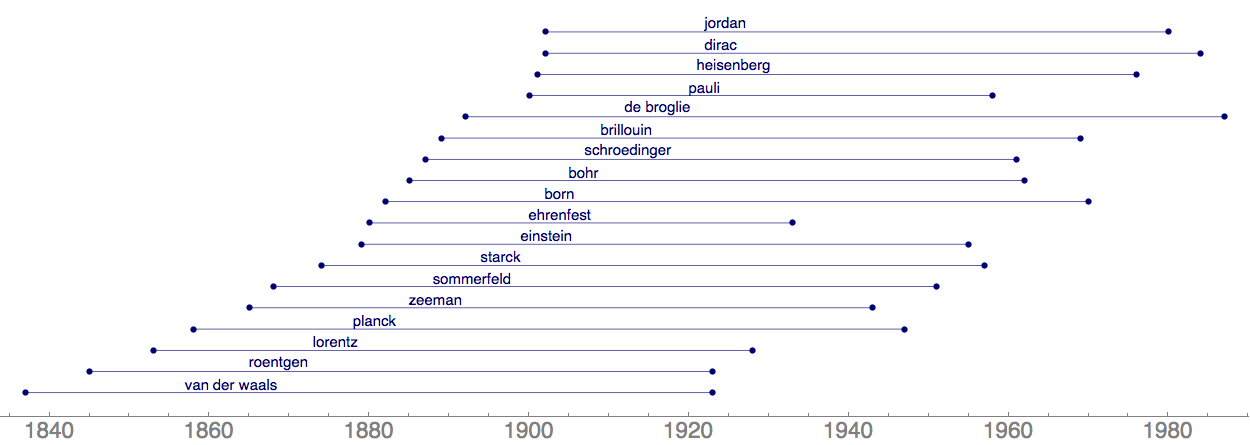
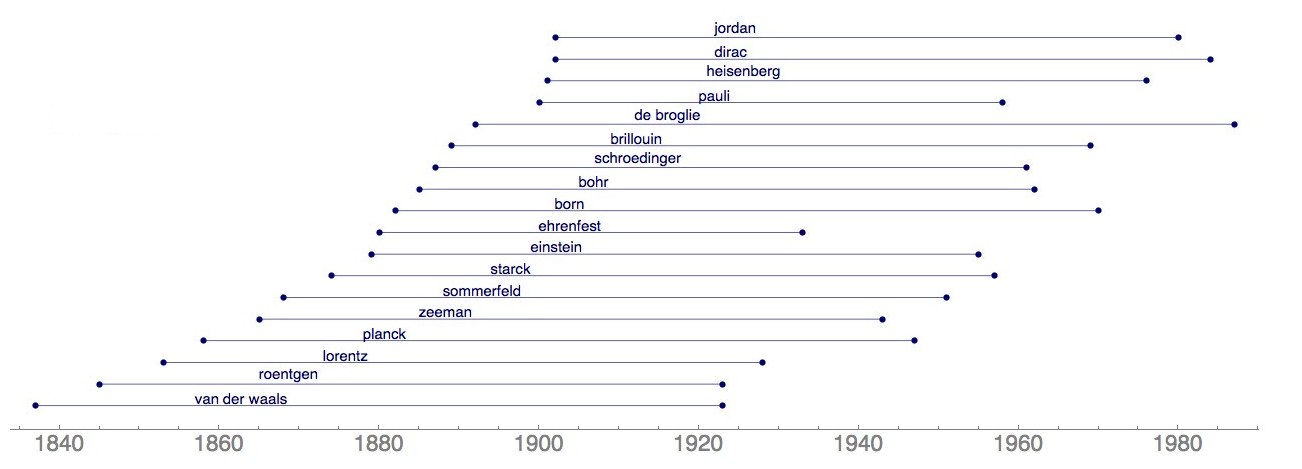
The problem stems from the y-shift introduced by the 3rd argument to Text, which is in a different coordinate system from the main plot. You need to get rid of the y-shift in the 3rd argument and do the shift in the 2nd argument.
Change
Text[Style[name, FontFamily -> "Helvetica",
  FontSize -> 12], {(b + 20), y}, {-1, -0.85}]
to
Text[Style[name, FontFamily -> "Helvetica", FontSize -> 12], {(b + 20), y + .35}, {-1, 0}]
and see if that works.

You may have to tweak the 0.35 shift. I set that by trial-and-error.
Edit
OP's code as modified by me.
q =
  {"roentgen" -> {1845, 1923}, "lorentz" -> {1853, 1928},
   "zeeman" -> {1865, 1943}, "van der waals" -> {1837, 1923},
   "starck" -> {1874, 1957}, "einstein" -> {1879, 1955},
   "bohr" -> {1885, 1962}, "ehrenfest" -> {1880, 1933},
   "born" -> {1882, 1970}, "schroedinger" -> {1887, 1961},
   "pauli" -> {1900, 1958}, "de broglie" -> {1892, 1987},
   "heisenberg" -> {1901, 1976}, "dirac" -> {1902, 1984},
   "jordan" -> {1902, 1980}, "planck" -> {1858, 1947},
   "sommerfeld" -> {1868, 1951}, "brillouin" -> {1889, 1969}};

Module[{color1 = Darker @ Darker @ Blue},
  Graphics[({#1, #2[[1]]} & ~MapIndexed~
    SortBy[q, #[[2, 1]]&]) /. {name_ -> {b_, d_}, y_} :> {color1,
    Text[Style[name, FontFamily -> "Helvetica", FontSize -> 12],
      {(b + 20), y + .35}, {-1, 0}],
    Thickness[0.0005], Line[{{b, y}, {d, y}}], PointSize[0.005],
    Point[{b, y}], Point[{d, y}]},
    ImageSize -> 1000,
    AspectRatio -> 1/3,
    FrameStyle -> Directive[{Gray, FontSize -> 18, FontFamily -> "Helvetica"}],
    Frame -> {Automatic, None, None, None}]]


