3
$\begingroup$

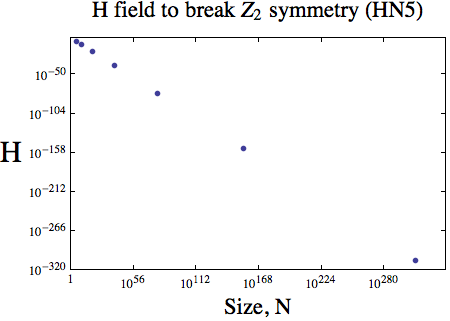
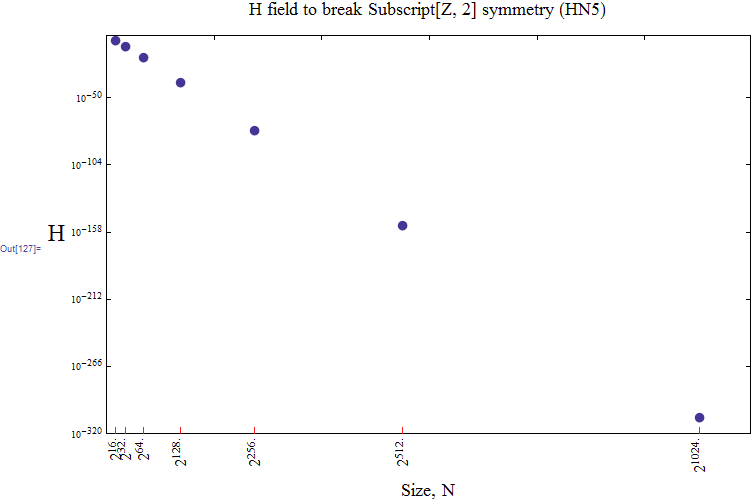
I am using ListLogLogPlot and would like to express the x-axis tick labels in powers of 2 instead of the default powers of 10. Does anybody have experience with this? Here is my code thus far:

mylist = 
  {{2^1024, 10^-307}, {2^512, 10^-153}, {2^256, 10^-76}, {2^128, 10^-38}, {2^64,10^-18},
   {2^32, 10^-9}, {2^16, 10^-4}};

ListLogLogPlot[mylist,
  PlotLabel -> Style["H field to break Subscript[Z, 2] symmetry (HN5)", FontSize -> 18],
  PlotStyle -> {PointSize[0.015]},
  Frame -> True,
  PlotRange -> {{1, 10^335}, {10^-320, 10^0}},
  FrameLabel -> {Style["Size, N", FontSize -> 18],
  Style["H", FontSize -> 24]}, RotateLabel -> False]

enter image description here

$\endgroup$

4 Answers 4

4
$\begingroup$

Using and expanding rm-rf function from How can I get exactly 5 logarithmic divisions of an interval?

findLogDivisions[{xmin_, xmax_}, n_Integer, b_: 10] := {
                           b^#, HoldForm[b^#]} & /@ FindDivisions[Log[b, {xmin, xmax}], n]

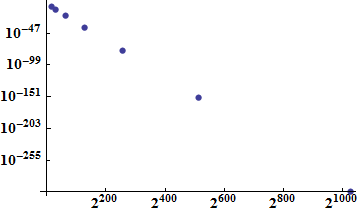
ListLogLogPlot[mylist, Ticks -> {(findLogDivisions[{#, #2}, 7, 2] &), Automatic}]

enter image description here

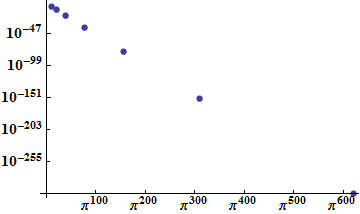
For findLogDivisions[{#, #2}, 7, Pi]:

enter image description here

$\endgroup$
2
  • $\begingroup$ useful function, will have to add +1 :) $\endgroup$
    – ubpdqn
    Commented Mar 23, 2014 at 12:28
  • $\begingroup$ All of these answers were very helpful, and I like how generalized this one is. Thank you everybody for your help! $\endgroup$
    – tn3rt
    Commented Mar 23, 2014 at 15:35
3
$\begingroup$

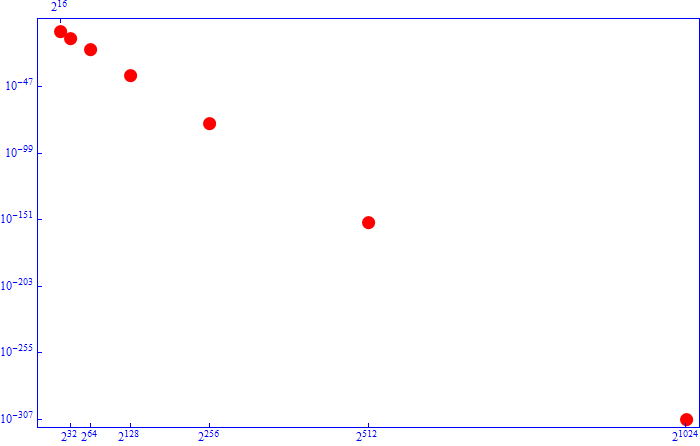
Here is a way. I have not used titles. I have just used ticks from the dataset but placed the first tick on top frame to avoid crowding. There are other ways but I hope this provides motivation to achieve the ticks and layout you want.

mylist = {{2^1024, 10^-307}, {2^512, 10^-153}, {2^256, 
    10^-76}, {2^128, 10^-38}, {2^64, 10^-18}, {2^32, 10^-9}, {2^16, 
    10^-4}};
tcks = {#, 
     StringForm["\!\(\*SuperscriptBox[\(2\), \(`1`\)]\)", 
      Log[2, #]]} & /@ mylist[[All, 1]];
ListLogLogPlot[mylist, Frame -> True, 
 FrameTicks -> {Rest@Sort[tcks], Automatic, {First@Sort[tcks]}, None},
  PlotStyle -> Red, BaseStyle -> {12, PointSize[0.02], Blue}]

enter image description here

$\endgroup$
2
$\begingroup$

This is not an ideal solution unless you are ok with the x tick location being the same as data.

mylist = {{2^1024, 10^-307}, {2^512, 10^-153}, {2^256, 10^-76}, 
    {2^128, 10^-38}, {2^64, 10^-18}, {2^32, 10^-9}, {2^16, 10^-4}};

 ticks[min_, max_] := 
  Table[{z = N@Log[mylist[[i, 1]]]/Log[2]; mylist[[i, 1]], Style[Rotate[2^ToString[z],
      Pi/2], 16], {.01, 0.0}, Red}, {i, Length[mylist]}];


ListLogLogPlot[
 mylist,
 PlotLabel -> Style["H field to break Subscript[Z, 2] symmetry (HN5)", FontSize -> 18],
 PlotStyle -> {PointSize[0.015]},
 Frame -> True,
 PlotRange -> {{1, 10^335}, {10^-320, 10^0}},
 FrameLabel -> {Style["Size, N", 18], Style["H", 24]},
 RotateLabel -> False, FrameTicks -> {{Automatic, Automatic}, {ticks, Automatic}}]

Mathematica graphics

I wish Mathematica would pass the tick location to the user, so that the user can just change the labels.

$\endgroup$
3
  • $\begingroup$ I agree customizable tick positions would be nice...I dealt with crowding by moving tick label to top frame...not ideal I guess $\endgroup$
    – ubpdqn
    Commented Mar 23, 2014 at 7:55
  • $\begingroup$ @ubpdqn lets hope in V 10 they made it more easy to change the tick labels ! $\endgroup$
    – Nasser
    Commented Mar 23, 2014 at 8:02
  • $\begingroup$ agreed...looking forward to v.10...still no real understanding of Wolfram Language means but some very interesting hints/previews around... $\endgroup$
    – ubpdqn
    Commented Mar 23, 2014 at 8:06
0
$\begingroup$

My answer is along a similar vein as those by @ubpdqn and @Nasser, but I thought it would be easier to control the spacing of the labels by switching it to ListPlot and dealing with the logs manually. You can then either use the normal output of the min and max from Ticks to set the limits or set the top, bottom and the increment manually. I provide a blended example which sets the top of the y and the right of the x based upon the Ticks and the rest set as variables so that you could optimize the figure prior to finalizing.

    Clear["Global`*"];
    mylist = {{2^1024, 10^-307}, {2^512, 10^-153}, {2^256, 
        10^-76}, {2^128, 10^-38}, {2^64, 10^-18}, {2^32, 10^-9}, {2^16, 
        10^-4}};

    mylist2 = {Log[2, #1], Log[10, #2]} & @@@ mylist;

    log2min = 128;
    log2inc = 256;
    log10max = -40;
    log10inc = 40;

    myticks2[min_, max_] := 
      Table[{x, Superscript[2, x]}, {x, log2min, max, log2inc}];
    myticks10[min_, max_] := 
      Table[{x, Superscript[10, x]}, {x, min, log10max, log10inc}];

    ListPlot[mylist2, 
     PlotLabel -> 
      Style["H field to break Subscript[Z, 2] symmetry (HN5)", 
       FontSize -> 18], PlotStyle -> {PointSize[0.015]}, 
     FrameTicks -> {{myticks10, None}, {myticks2, None}}, Frame -> True, 
     PlotRange -> {{0, 1280}, {-320, 0}}, 
     FrameLabel -> {Style["Size, N", FontSize -> 18], 
       Style["H", FontSize -> 24]}, RotateLabel -> False]

I decided that it would be nice to be able to interactively Manipulate the various values, including changing the the base for the log function. Here is that version.

    Clear["Global`*"]; 
    Manipulate[
     mylist = {{2^1024, 10^-307}, {2^512, 10^-153}, {2^256, 
        10^-76}, {2^128, 10^-38}, {2^64, 10^-18}, {2^32, 10^-9}, {2^16, 
        10^-4}};

     mylist2 = {Log[scaleX, #1], Log[scaleY, #2]} & @@@ mylist; 
     myticksX = 
      Table[{x, Superscript[scaleX, x]}, {x, logXmin, logXmax, logXinc}];
     myticksY = 
      Table[{x, Superscript[scaleY, x]}, {x, logYmin, logYmax, logYinc}];

     ListPlot[mylist2, 
      PlotLabel -> 
       Style["H field to break Subscript[Z, 2] symmetry (HN5)", 
        FontSize -> 18], PlotStyle -> {PointSize[0.015]}, 
      FrameTicks -> {{myticksY, None}, {myticksX, None}}, Frame -> True, 
      PlotRange -> {{0, 1280}, {-320, 0}}, 
      FrameLabel -> {Style["Size, N", FontSize -> 18], 
        Style["H", FontSize -> 24]}, RotateLabel -> False],
     {{scaleX, 2, "Log Scale For X-Axis"}, 2, 16, 1},
     {{scaleY, 10, "Log Scale For Y-Axis"}, 2, 16, 1},
     Delimiter,
     {{logXmin, 256, "Minimum for X-Axis"}, 0, 2048},
     {{logXmax, 2048, "Maximum for X-Axis"}, 0, 2048},
     {{logXinc, 256, "Increment for X-Axis"}, 32, 2048, 32},
     {{logYmin, -320, "Minimum for Y-Axis"}, -360, -300, 1},
     {{logYmax, -40, "Maximum for Y-Axis"}, 0, -80, 1},
     {{logYinc, 40, "Increment for Y-Axis"}, 1, 300, 10}, 
     ControlPlacement -> Top]
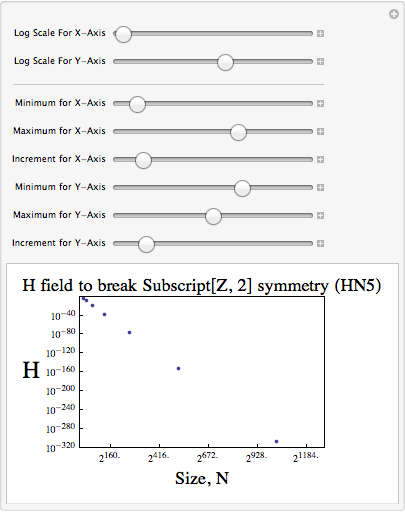
Mathematica graphics

$\endgroup$

Your Answer

By clicking “Post Your Answer”, you agree to our terms of service and acknowledge you have read our privacy policy.

Not the answer you're looking for? Browse other questions tagged or ask your own question.