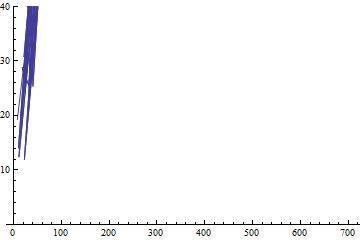
I'm trying to do a Fourier Transform of the following Data, but I'm completely stuck.
Here's what I've done so far:
data = Drop[data, 1];
dat = data /. {x_, y_, z_, w_} -> {x + y/12., 10 z};
ListLinePlot[Abs[Fourier[dat]], PlotRange -> {Automatic, {0, 40}}]
I don't understand why it keeps displaying this weird plot

Anyone have any clue what I'm doing wrong? I'm just learning this Fourier thing so I'm real lost.


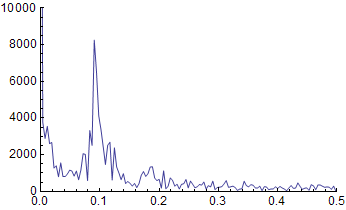
ListPlot[Abs[Fourier[dat]], PlotRange -> {Automatic, {0, 350}}]Result $\endgroup$