1
$\begingroup$

I am trying to build an IS/LM model with sliders for a few things including the slope of the IS curve. I am stuck getting the equilibrium ticks and dashed lines to properly follow the intersection of the two lines when the slope is changed. I have tried incorporating my variable i in as many ways as I can think of into the ticks and dashed lines, but continually come up short. I am a newbie at Mathematica and the code is confusing the hell out of me and making the basic math more confusing for me. Help!

Manipulate[
  Show[
    Plot[Tooltip[s + .8 *q, "LM"], {q, 0, 150}, 
      AxesOrigin -> {0, 0}, PlotStyle -> {Thick, Blue}, 
      AxesLabel -> {"GDP", "Interest Rate"}, 
      PlotRange -> {{0, 100}, {0, 100}}, PlotLabel -> IS LM, 
      Ticks -> {{{0.77*d - (0.77*s), "GDP"}}, {{d - i*(0.77*d - (0.77*s)), "r"}}}, 
      BaseStyle -> {FontWeight -> "Bold", FontSize -> 12}], 
    Plot[Tooltip[d - i*q, "IS"], {q, 0, 200}, 
      AxesOrigin -> {0, 0}, PlotStyle -> {Thick, Green}], 
    Graphics[{Dashed, 
      Line[{{0.77*d - (0.77*s), 0}, 
            {0.77*d - (0.77*s), d - i (0.77*d - 0.5 (0.77*s))}}]}], 
    Graphics[{Dashed, 
      Line[{{0, d - i (0.77*d - (0.77*s))}, 
            {0.77*d - (0.77*s), d - i (0.77*d - (0.77*s))}}]}]], 
  {{d, 75, "Fiscal Policy"}, 50, 100, 2},
  {{s, 0, "Monetary Policy"}, 0, 100, 2}, 
  {{i, .5, "Interest Sensitivity"}, 0, 5, .1}]
$\endgroup$
3
  • $\begingroup$ Glancing at your code, it looks like you are converting a previous static example with specific values for each of d, s, and i to the Manipulate. I think that several of your values that are numerical need to be expressed in terms of your three variables. Specifically I would look at 0.8 (in Plot), the ubiquitous 0.77, and the 0.5 should be i (in first Dashed Line. If you fix those instances with the appropriate formulas, my guess is that most of your worries will be fixed. $\endgroup$ Commented Mar 10, 2014 at 6:14
  • 1
    $\begingroup$ The second point in your first Dashed Line should be {0.77*d - (0.77*s), d - i (0.77*d - (0.77*s))} $\endgroup$
    – qwerty
    Commented Mar 10, 2014 at 6:43
  • $\begingroup$ After esprit's fix, you can figure out what the 0.77 should be in terms of formula by setting the IS=LM and then solving for the q that is the intersection of the two lines. You'll find that the ratio q/d at init cond is 0.77. From there you should be able to figure out how to calculate a value for 0.77 that depends upon your variable i and the 0.8 that is in the LM equation. Plug that expression everywhere there is a 0.77. I don't know what that 0.8 means in terms of economics, but it is my guess you will want to be able to vary it as well. Also, your two ranges for q are different. $\endgroup$ Commented Mar 10, 2014 at 6:55

1 Answer 1

4
$\begingroup$

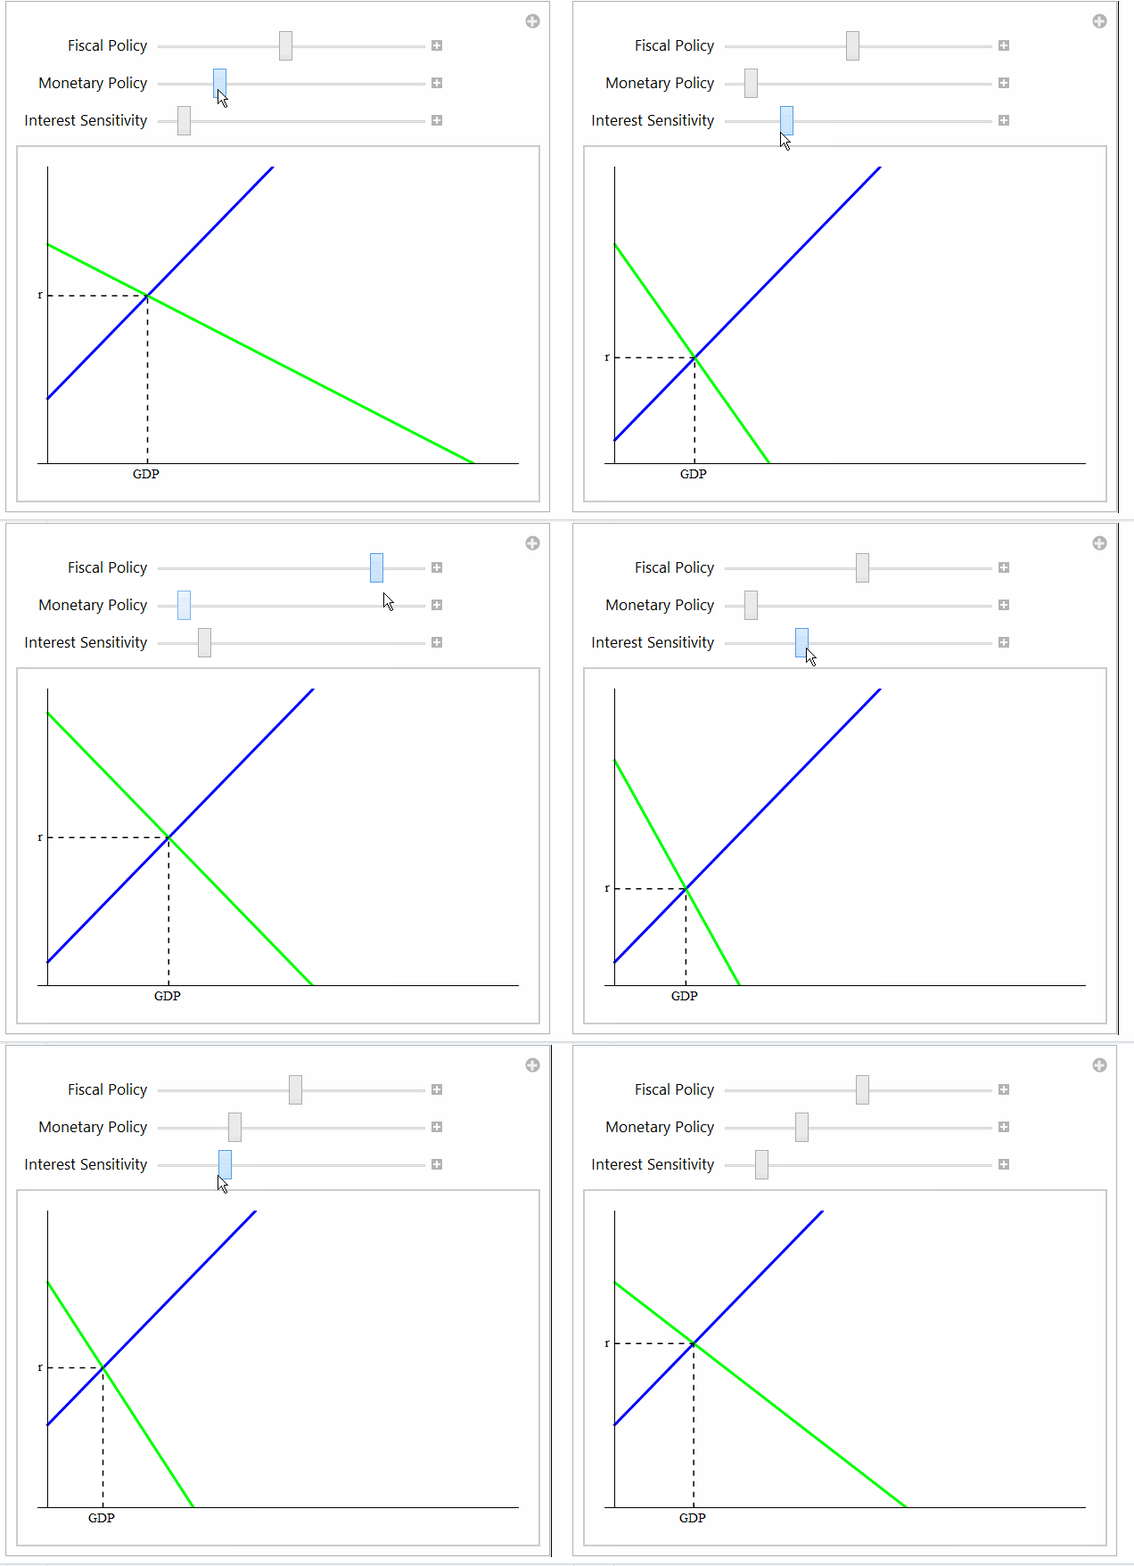
I am uncertain if this is what you are after. A static baseline plot (reference) starting position I guess could be added. If the aim is simpler this may be helpful:

Manipulate[sol = q /. First@Solve[lm[s, q] == is[d, i, q], q];
 ysol = lm[s, sol];
 tcks = {{{sol, "GDP"}}, {{ysol, "r"}}};
 lns = {{Dashed, Line[{{sol, 0}, {sol, ysol}}]}, {Dashed, 
    Line[{{0, ysol}, {sol, ysol}}]}};
 Plot[{lm[s, q], is[d, i, q]}, {q, 0, 200}, Ticks -> tcks, 
  Epilog -> lns, PlotRange -> {0, 100}, 
  PlotStyle -> {{Thick, Blue}, {Thick, Green}}], {{d, 75, 
   "Fiscal Policy"}, 50, 100, 2}, {{s, 0, "Monetary Policy"}, 0, 100, 
  2}, {{i, .5, "Interest Sensitivity"}, 0, 5, .1}, 
 Initialization :> (lm[x_, y_] := x + .8*y;
   is[x_, y_, z_] := x - y*z)]

enter image description here

The tooltips and other style formatting can be adapted as desired.

$\endgroup$
2
  • $\begingroup$ @ubpdqn I saw answers like yours, with animated GIFs, a lot the last few days. Have you, or is there a tutorial for creating these GIFs from Mathematica? $\endgroup$
    – Phab
    Commented Mar 11, 2014 at 10:13
  • 1
    $\begingroup$ @Phab Here are some useful resources (the first is free and makes life very easy): cockos.com/licecap and community.wolfram.com/groups/-/m/t/74556 and community.wolfram.com/groups/-/m/t/86994 (these were just easy to find links and there are similar links on Mathematica Stackexchange that you can search) $\endgroup$
    – ubpdqn
    Commented Mar 11, 2014 at 11:58

Your Answer

By clicking “Post Your Answer”, you agree to our terms of service and acknowledge you have read our privacy policy.

Not the answer you're looking for? Browse other questions tagged or ask your own question.