8
$\begingroup$

I'm having some trouble getting a dynamic plot to operate efficiently, and I think I've tracked down at least part of the problem to some pretty weird behaviour on the part of LocatorPane.

Take two different image backgrounds, which can be quite similar except for their size on disk:

image1 = ContourPlot[x^2-y^2, {x, -1, 1}, {y, -1, 1}, ImageSize -> 250];

image2 = ContourPlot[x^2-y^2, {x, -1, 1}, {y, -1, 1}, ImageSize -> 250, PlotPoints -> 200];

where the ByteCount of image2 is, in this case, about twenty times bigger than that of image1, and now use these images as the background for a LocatorPane:

point = {0.4, 0};
Row[{
  LocatorPane[
   Dynamic[point],
   image2
   ],
  Dynamic[point]
  }]

which produces something like this
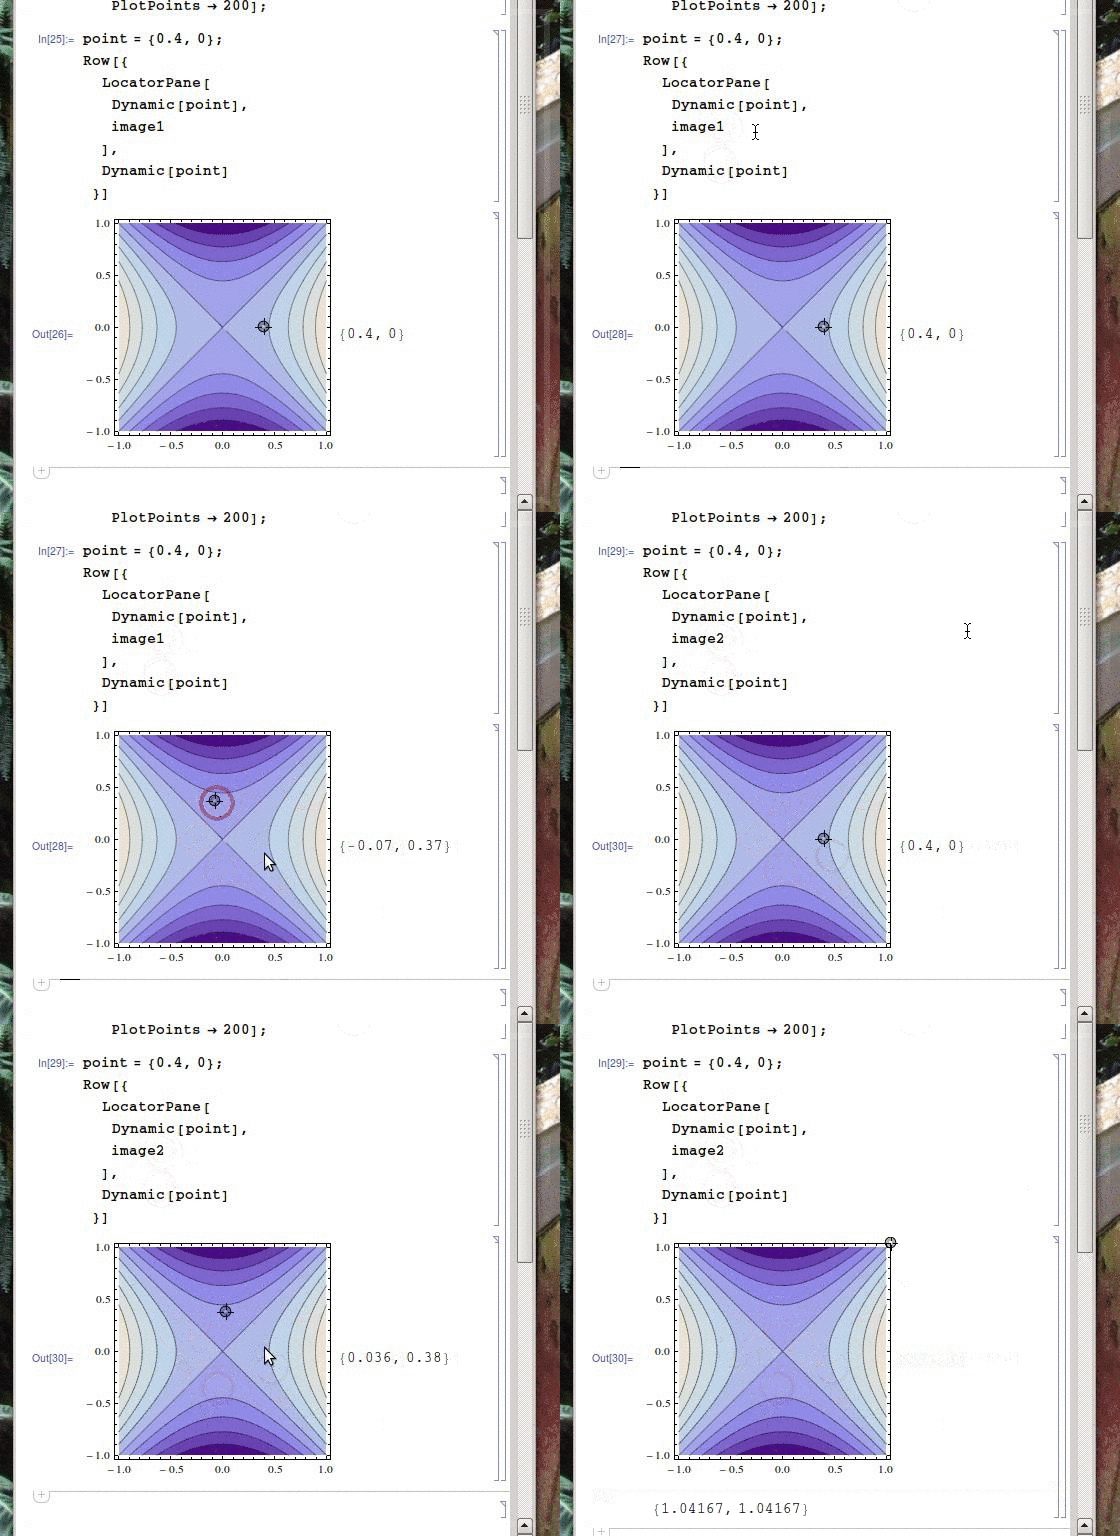
enter image description here

As you can see, the version with the heavier background is a huge lot more sluggish than the lighter one (though this is much more evident if you run it yourself). Why is this? Both occurrences of point are inside a Dynamic command but the background is not, so I don't really see a reason for the background of the pane to be re-loaded every time the locators are changed. More importantly, how can this be avoided? I have a byte-heavy background which I would like to only calculate once and then display without it slowing me down.

I should also note that raster-based solutions will most likely prove unsatisfactory, particularly because I want to deploy a fair bit of information in the tooltips associated with the background contours.

$\endgroup$

1 Answer 1

6
$\begingroup$

Well, that's not a full answer but a walkaround.

I've noticed that even when only moving cursor in front of image2 (without LocatorPane) CPU usage is raising to 50% and supressing Tooltips does not change much.

So since you want them, leave them, and Rasterize the rest:

 point = {0.4, 0};
 Row[{
  Overlay[{
    Rasterize@image2,
    LocatorPane[Dynamic[point],
                image2 /. _Polygon :> {}
               ]
    }, All, 2, Alignment -> Center]
  ,
  Dynamic[point]}]

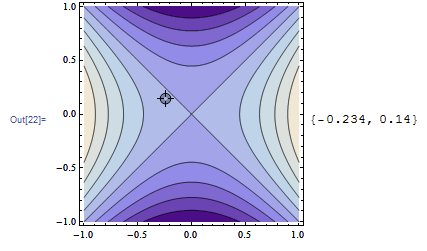
enter image description here

$\endgroup$
2
  • $\begingroup$ that's probably enough of a walkaround for my purposes, though I need to test it on my bigger system to be sure. I can't see why it works, though! Why is image2 /. _Polygon :> {} any faster to display than the original? It would seem they contain essentially the same information, minus the colouring. From what I can see, the coloured regions are polygons with corners where the contour lines have corners; why are those so much slower to display? $\endgroup$ Commented Mar 1, 2014 at 20:18
  • $\begingroup$ @episanty I really do not know, I think it is the question to WRI or someone else that know more abour graphics. Yes, those polygons have the same vertices as contour lines. Which means they are quite complex. Let me know how it works with your real examples. $\endgroup$
    – Kuba
    Commented Mar 2, 2014 at 8:41

Your Answer

By clicking “Post Your Answer”, you agree to our terms of service and acknowledge you have read our privacy policy.

Not the answer you're looking for? Browse other questions tagged or ask your own question.