23
$\begingroup$

I'm trying to find out if it's possible to find the beat of a tune by Fourier analysis with Mathematica. I'm taking a 44.1 kHz sample sound and hoping that I might get a nice peak for a frequency somewhere in the window of reasonable bpm (so, 60 to 100 per minute).

s = Import["Eleanorrigbylive.wav"];
raw = First@First@First@s;
avg = Table[Mean[Abs /@ raw[[i ;; i + 127]]], {i, 1, Length@raw/128}];
avg = Drop[avg, Floor[Length@avg/10]];

So, I'm importing the raw data and storing one channel's samples into raw. Because 44.1 kHz is way to much for what I want to do, I downsample it by averaging over blocks of size 128, so avg corresponds to samples at 344.5 Hz (which should be enough for my measurement of a 1 to 2 Hz phenomenon). Then, I'm dropping the intro of the song :)

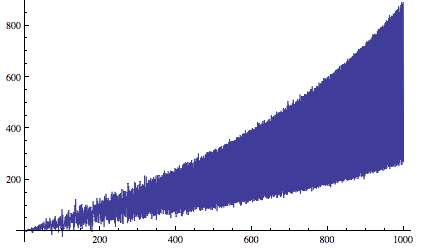
However, Fourier analysis in the expected window is more than disappointing:

ListLinePlot[
 MapIndexed[(First@#2)^2*#1 &, FourierDST@avg[[1 ;; 1000]]]]
enter image description here

Thus, my questions are:

  • am I missing some Mathematica functionality which would not require me to do this the hard way?
  • is my analysis incorrect? how could I determine the beat of a sound sample?
$\endgroup$
7
  • 5
    $\begingroup$ My understanding is that the fourier transform is related to the power spectral density. There are some factors which will complicate this analysis. The psychoacoustical perception of a 'beat' is not necessarily directly related to the energy content of the audio signal. The incident sound is transformed by the non-linear frequency response of the ear - see Fletcher–Munson curves - There could be a 20dB in power level between a low frequency note and a high frequency one producing a similar "beat". Then the duration of a signal that create a beat (cymbal/kick drum) may be very different. $\endgroup$ Commented Apr 15, 2012 at 11:04
  • 2
    $\begingroup$ You might want to have a look at this reference. $\endgroup$ Commented Apr 15, 2012 at 11:09
  • 1
    $\begingroup$ This looked interesting as well. $\endgroup$ Commented Apr 15, 2012 at 11:30
  • 4
    $\begingroup$ Sounds like your question is more signal processing than Mathematica related. I suggest migration to Signal Processing $\endgroup$
    – rm -rf
    Commented Apr 15, 2012 at 15:12
  • $\begingroup$ Could you explain the (First@#2)^2*#1 & term? I know what it does, but I don't understand why you do this. $\endgroup$ Commented Apr 15, 2012 at 15:33

3 Answers 3

22
$\begingroup$

Here's a possible starting point for a solution. It splits the sample list into chunks and measures the Norm of the sample Differences in each chunk, and then does the FFT on that data.

bpmplot[snd_, bpmmax_: 300] := 
Module[{samples, minfreq, signal, fft},
samples = snd[[1, 1, 1]];
minfreq = snd[[1, 2]]/Length[samples];
signal = (Norm[Differences[#]]) & /@ Partition[samples, 128];
fft = Abs[Fourier[signal][[;; Floor[bpmmax/(120 minfreq)]]]];
fft[[;; 10]] *= 0; (* remove very low frequencies *)
ListLinePlot[MapIndexed[{120 (#2[[1]] - 1) minfreq, #1} &, fft], 
PlotRange -> All, Frame -> True, FrameLabel -> {"BPM", "Signal"}, 
BaseStyle -> {FontFamily -> "Calibri", 20}]];

snd = Import["C:\\Users\\Simon\\Desktop\\02 - Money For Nothing.wav"];

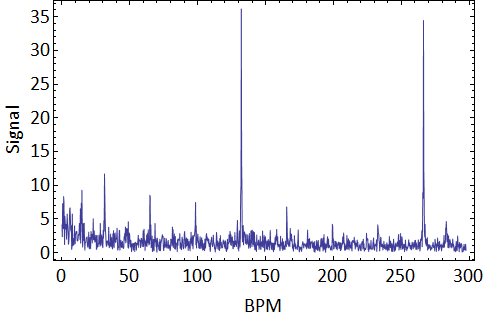
bpmplot[snd]

enter image description here

Google tells me that the BPM for this track is 134, and you can see that it has picked that frequency out quite well, though there are many other peaks too, especially the harmonic at 268 bpm.

$\endgroup$
3
  • $\begingroup$ Hi @SimonWoods . I was studying your nice answer and I would like to know if the most precise way was in fft = Abs[Fourier[signal][[10 ;; Floor[bpmmax/(120 minfreq)]]]]; to make 1 ;; insted of 10 ;; , and then truncate fft making fft[[1;;10]]=0 ? I think that in this way I get exactly 134 beat. tks in advance. $\endgroup$
    – Murta
    Commented Nov 18, 2012 at 23:44
  • $\begingroup$ @Murta, yes that would be better, well spotted - thanks. $\endgroup$ Commented Nov 19, 2012 at 10:15
  • $\begingroup$ Update for new Mathematica Audio object: samples = AudioData[snd][[1]]; minfreq = QuantityMagnitude@AudioSampleRate[snd]/Length[samples]; $\endgroup$
    – Murta
    Commented Nov 29, 2019 at 1:47
11
$\begingroup$

I feel there may be a few issues here. First, you're using FourierDST, the discrete sine transform. I'm not too familiar with this one, but it looks like you shouldn't confuse it with Fourier.

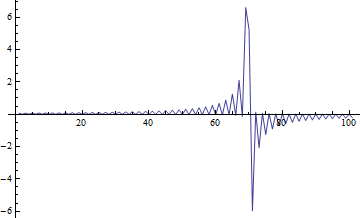
Application of FourierDST as follows:

ListLinePlot[
 FourierDST[Table[Sin[100 t], {t, 0, 10, 0.02}]][[250 ;; 350]], 
 PlotRange -> All]

yields:

Mathematica graphics

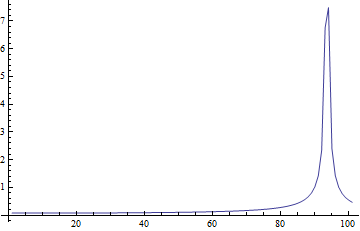
whereas, with Abs@Fourier (plotting the amplitude)

ListLinePlot[
 Abs@Fourier[Table[Sin[100 t], {t, 0, 10, 0.02}]][[250 ;; 350]], 
 PlotRange -> All]

you get:

Mathematica graphics.

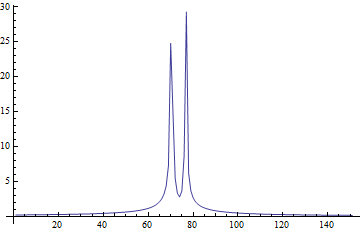
The differences are even more extreme in this case:

ListLinePlot[
 FourierDST[
   Table[Sin[1000 t] + Sin[1020 t], {t, 0, 2, 1./2000}]][[250 ;; 
    400]], PlotRange -> All]

Mathematica graphics

ListLinePlot[
 Abs[Fourier[
    Table[Sin[1000 t] + Sin[1020 t], {t, 0, 2, 1./2000}]]][[250 ;; 
    400]], PlotRange -> All]

Mathematica graphics

The latter gives me two peaks precisely as expected, whereas I have difficulties interpreting the first one. Obviously, FourierDST has different applications than Fourier.

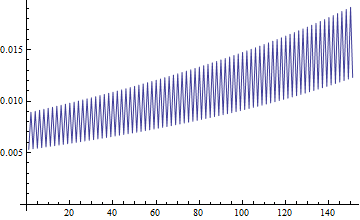
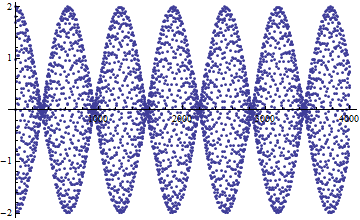
My second remark is related to the last function. You see the amplitude spectrum above, but let's look to the signal itself:

Table[Sin[1000 t] + Sin[1020 t], {t, 0, 2, 1./2000}] // ListPlot

Mathematica graphics

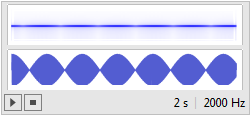
Quit obviously, you have a beat pattern here, which is very audible:

Sound[SampledSoundList[Table[Sin[1000 t] + Sin[1020 t], {t, 0, 2, 1./2000}], 2000]]

Mathematica graphics

The beat frequency is at a differential frequency, but you don't see this in the Fourier plot! So, the take-home message is: It's not that easy to spot beats in spectrograms.

$\endgroup$
5
  • $\begingroup$ Actually it's easy: The beat frequency is just twice the difference between the frequencies of the two peaks (twice because the hull repeats after half a sine). An audible beating happens if the frequencies are close enough to each other. The exact threshold is known (but not to me). $\endgroup$
    – celtschk
    Commented Apr 15, 2012 at 16:38
  • 3
    $\begingroup$ Your interpretation of beat is different from the OP's. You're using the acoustic definition of beat, in which occurs when two frequencies are close to each other, whereas OP intended beat as in a measure of time or the pulse of the music — like a prominent periodic hit of the drum or in the case of their example, the viola/violin that just repeats in the background. This is not all that simple and I think it's out of scope for mma.se. I suggested asking at Signal Processing, but they didn't seem to care. $\endgroup$
    – rm -rf
    Commented Apr 15, 2012 at 16:46
  • $\begingroup$ @celtschk I know that and I wrote about that too. Why do you think I choose this example? The point I wanted to make in the second part: there is more going on in what you hear than what you see in a fourier analysis. $\endgroup$ Commented Apr 15, 2012 at 16:48
  • $\begingroup$ @R.M I'm fully aware of that (I play drums and know a bit about beats), but what I wanted to make clear (but apparently didn't succeed in doing) is that a fourier plot doesn't necessary give you all the information you need to find a beat. $\endgroup$ Commented Apr 15, 2012 at 16:51
  • $\begingroup$ @SjoerdC.deVries If the beat is prominent, you can try autocorrelating the spectrogram (or STFT) in time and you could see it. $\endgroup$
    – rm -rf
    Commented Apr 15, 2012 at 16:54
5
$\begingroup$

Sonic Visualiser is a point and click interface for all sorts of audio tasks, from analysis, filtering, beat detection, etc. You should play around with it (does take some getting used to) and download the freeware plugins too.

Once you get the hang of it, you might want to try Sonic Annotator, which is, I believe, just a text based interface to Sonic Visualiser's capabilities. If so desired, you could perhaps construct a Mathematica function that calls Sonic Annotator to do what you want.

Finally, I'm pretty sure the main project and most of the plugins are open source. (So feel free to trudge through it all and post some interesting stuff — implemented in pure Mathematica — back here...)

$\endgroup$
4
  • $\begingroup$ @F'x, thanks for editing my sloppy links. Have you DL'ed Sonic Vis yet? Playing with it and reading the docs and how to's should get you pointed in the right direction---you might otherwise waste a lot of time trying to reinvent the wheel. There are a number of different algorithms and parameters to consider based on the source material. I've used Sonic Vis in the past to extract a tempo map from WAV files -> MIDI -> feed drum sample sequencer. $\endgroup$ Commented Apr 15, 2012 at 18:59
  • $\begingroup$ thanks for the links, but I'm really more interested in a proof of concept, a small study where I can understand what would work and what won't, than in a ready-made software… $\endgroup$
    – F'x
    Commented Apr 15, 2012 at 19:01
  • $\begingroup$ @F'x - I understood your intent. I recommend SV as a way to grasp (very quickly) what algorithms are 'out there' and working. Just reading the documentation and playing around a little would surely give you a broader understanding and save you some time in the long run. Best to understand what you want to program before trying to program it. Just trying to help. :) $\endgroup$ Commented Apr 23, 2012 at 3:07
  • 1
    $\begingroup$ Since this is really only pointing to an external program and not a solution in Mathematica, I would suggest posting it as a comment. $\endgroup$
    – rm -rf
    Commented Aug 3, 2012 at 5:34

Your Answer

By clicking “Post Your Answer”, you agree to our terms of service and acknowledge you have read our privacy policy.

Not the answer you're looking for? Browse other questions tagged or ask your own question.