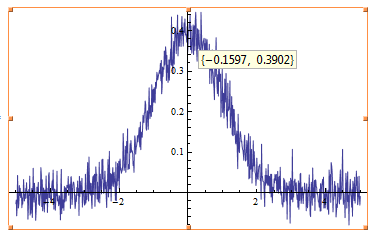
I am preparing an activity that simulates the response from a noisy spectrometer. The function I use to generate the data has the form:
curve[a_, x_] :=
  a PDF[NormalDistribution[0, 1], x] +
   RandomVariate[NormalDistribution[0, 0.03]];
Which produces something like:
Plot[curve[1, x], {x, -5, 5}, PlotPoints -> 200, MaxRecursion -> 2]

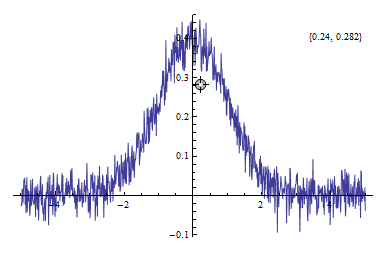
and I can get the coordinates using a right mouse button click on the plot. The right mouse button works differently in a CDF than it does in a Notebook and I would like to ultimately turn this activity into a CDF-enabled web page. My first attempt is to use a Locator
ControllerManipulate[
 Plot[curve[1, x], {x, -5, 5}, PlotPoints -> 200, MaxRecursion -> 2,
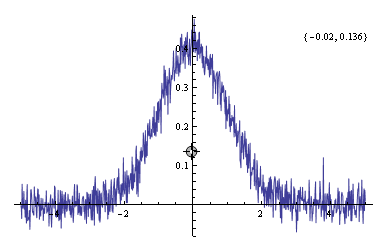
  Epilog -> Inset[p, Scaled[{0.9, 0.9}]]], {p, Locator}]

Which does the job except that when I move the locator, the "noise" in my plot changes. How do I modify my curve function so that I maintain the ability to generate a "unique" noise pattern each time curve is called but it does not continuously update when the end user moves a locator?

