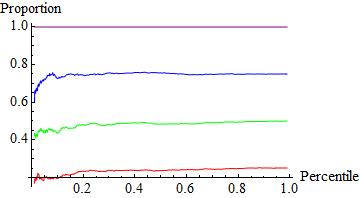
Post-generation styling
If I understand correctly Plot works correctly in your application (without Evaluate) with the exception of the line styling. If that is true you merely need to add the styling afterward. See Is it possible to change the color of plot in Show?. A variation of my restylePlot function from my answer there:
stylePlot[plot_Graphics, styles_List, op : OptionsPattern[Graphics]] :=
  Module[{x = styles, sfun},
    sfun = {Directive @ Last[x = RotateLeft @ x], #} &;
    Show[MapAt[# /. {__, ln__Line} :> sfun /@ {ln} &, plot, 1], op]
  ]
Example of use:
pl = Plot[metric[data, p], {p, 0.01, 0.99}, AxesLabel -> {"Percentile", "Proportion"}];

stylePlot[pl, {Red, Green, Blue, Purple}]

Intermediary function
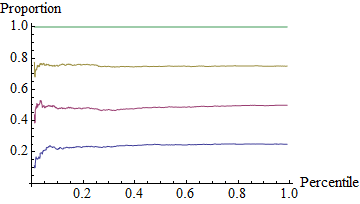
As described in Plot draws list of curves in same color when not using Evaluate Plot styles based on the explicit structure of its first argument, before evaluation. If it is not possible to evaluate your plot function without error, and you do not find post-generation styling acceptable, you will need to use some intermediary function to present your data, before evaluation, in a form that Plot will recognize. Here is a basic example of the form I am describing. (By the way, I am rewriting your metric function to properly localize x.)
data = RandomReal[10, {4, 1000}];
metric[data_, perc_] := With[{x = Quantile[#, perc] & /@ data}, Accumulate[x]/Total[x]];

f[x_] := f[x] = metric[data, x];

Plot[{
  f[p][[1]],
  f[p][[2]],
  f[p][[3]],
  f[p][[4]]
 },
 {p, 0.01, 0.99},
 AxesLabel -> {"Percentile", "Proportion"}
]

Here f exists merely to memoize metric, which prevents quadruple evaluation of every p value. The key is that there are four expressions in a List before evaluation, and each expression will evaluate to that part of the data as the Plot progresses. Any method that achieves this will work. Here is a different formulation with the memoizing made part of metric, and the function f serves to simplify programmatically generating the list of expressions for the first argument of Plot:
ClearAll[metric, f]

mem : metric[data_, perc_] :=
  mem = With[{x = Quantile[#, perc] & /@ data}, Accumulate[x]/Total[x]];

f[x_?NumericQ, n_] := metric[data, x][[n]];

Plot[Array[f[p, #] &, 4], {p, 0.01, 0.99}, AxesLabel -> {"Percentile", "Proportion"},
  Evaluated -> True]
I use Evaluated -> True because it localizes the Plot variable p, which Evaluate does not.


