6
$\begingroup$

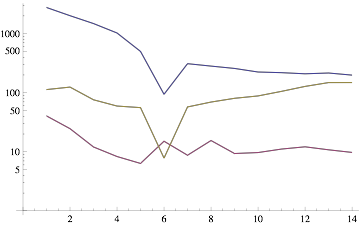
I have some chemical data that I am plotting using ListLogPlot.

data={{2776.37,2016.64,1483.51,1027.35,500.878,94.1385,310.402,282.548,
       257.886,224.359,218.688,209.312,215.776,198.78}, 
      {40.5063,24.633,12.069,8.3151,6.35135,15.0977,8.74372,15.5125,9.34959,
       9.70696,11.125,12.1457,10.8075,9.7561},
      {113.08,124.633,75.9698,59.5186,55.9459,7.81528,57.4372,69.5291,80.4878,
       88.2784,105.563,127.935,148.571,148.78}};

ListLogPlot[data, Joined -> True]
enter image description here

I want to replace the x-axis tick values with the associated elements.

e.g. replace 1,2,3,...,14 with

xaxis= {"La","Ce","Pr","Nd","Sm","Eu","Gd","Tb","Dy","Ho","Er","Tm","Yb","Lu"};

Any suggestions on how to achieve this? Is there another plot function that I should be using?

$\endgroup$
5
  • $\begingroup$ What's the deal with Europium? $\endgroup$
    – wxffles
    Commented Sep 5, 2013 at 3:56
  • $\begingroup$ @wxffles Indeed, europium is anomalous :) $\endgroup$
    – geordie
    Commented Sep 5, 2013 at 3:59
  • $\begingroup$ Nice plot, looks like an OIB REE pattern, I suppose you are working in geology/mineralogy? $\endgroup$ Commented Sep 5, 2013 at 8:22
  • $\begingroup$ @MockupDungeon Actually they are 1.7 - 1.6 Ga granitoids from the Mount Isa inlier, Australia. The samples with the strong negative Eu anomalies are incompatible element enriched granites and the other sample is a pegmatite that may have formed as a partial melt from one of these granites. $\endgroup$
    – geordie
    Commented Sep 5, 2013 at 11:56
  • $\begingroup$ OK, thanks for the details. Pegmatites, yeah, I worked on them as well, from Ikaria, Greece. Li,Be,B-contents. $\endgroup$ Commented Sep 6, 2013 at 9:40

1 Answer 1

11
$\begingroup$

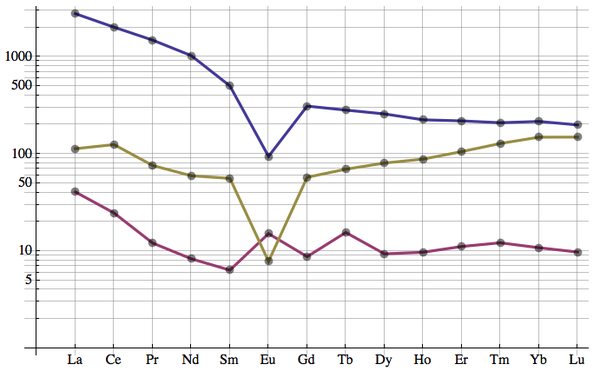
I personally would also try to style this to see everything better - something like this:

ListLogPlot[data, Joined -> True, 
  Ticks -> {Transpose[{Range[14], xaxis}], Automatic}, 
  PlotStyle -> Thick, GridLines -> {Range[14], Automatic}, 
  GridLinesStyle -> Opacity[.5], Mesh -> All, 
  MeshStyle -> Directive[PointSize[.015], Opacity[.5]]] // Magnify

enter image description here

$\endgroup$
4
  • 1
    $\begingroup$ Many thanks! Yes, the GridLines make it easier to read. Good to know about Magnify as well. $\endgroup$
    – geordie
    Commented Sep 5, 2013 at 3:46
  • $\begingroup$ @geordie One might use MapIndexed to avoid the hard-coded 14: Ticks -> {MapIndexed[{#2[[1]], #} &, xaxis], Automatic} $\endgroup$
    – Mr.Wizard
    Commented Sep 5, 2013 at 9:06
  • $\begingroup$ @Mr.Wizard thanks for the suggestion. I ended up using Ticks -> {Transpose[{Range@Length@xaxis, xaxis}], Automatic}. This seems to do pretty much the same thing. Although it is not quite as elegant, it is almost twice as fast according to AbsoluteTiming. $\endgroup$
    – geordie
    Commented Sep 5, 2013 at 11:50
  • 1
    $\begingroup$ @geordie I use that form a lot myself; it is particularly superior on packed arrays. However, in this case the speed shouldn't matter; you're not going to have a million tick labels. $\endgroup$
    – Mr.Wizard
    Commented Sep 5, 2013 at 11:57

Your Answer

By clicking “Post Your Answer”, you agree to our terms of service and acknowledge you have read our privacy policy.

Not the answer you're looking for? Browse other questions tagged or ask your own question.