7
$\begingroup$

I want to implement the MATLAB imshow function in Mathematica.

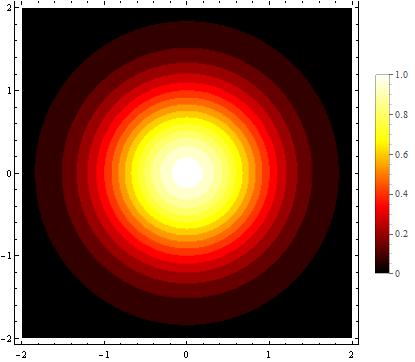
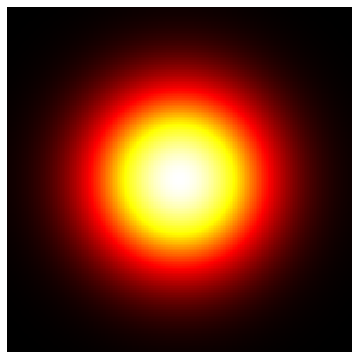
This is a DensityPlot[] from Mathematica

This pic was Densityplot by Mathematica

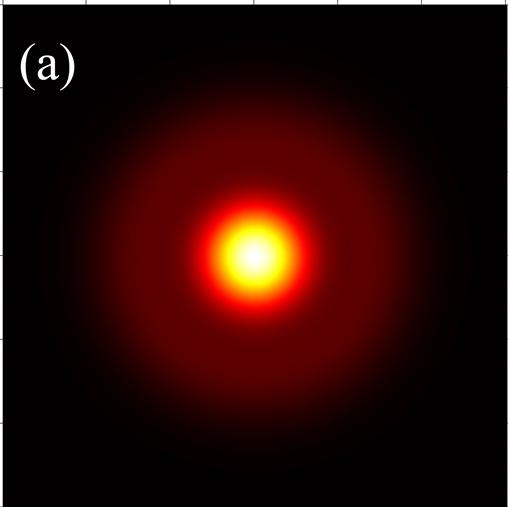
And this is imshow() image generated by MATLAB

This pic was print by imshow() from Matlab

As you can see there's a difference between the two plots. I want to obtain smooth transition in Mathematica as I can in MATLAB.

$\endgroup$
4
  • $\begingroup$ newcolor2 = {RGBColor[0, 0, 0], RGBColor[0.2, 0, 0], RGBColor[0.4, 0, 0], RGBColor[0.6, 0, 0], RGBColor[0.8, 0, 0], RGBColor[1, 0, 0], RGBColor[1, 0.2, 0], RGBColor[1, 0.4, 0], RGBColor[1, 0.6, 0], RGBColor[1, 0.8, 0], RGBColor[1, 1, 0], RGBColor[1, 1, 0.2], RGBColor[1, 1, 0.4], RGBColor[1, 1, 0.6], RGBColor[1, 1, 0.8], RGBColor[1, 1, 1]};DensityPlot[Exp[-x^2 - y^2], {x, -2, 2}, {y, -2, 2}, ColorFunction -> newcolor2, PlotLegends -> Automatic, PlotPoints -> 300] $\endgroup$
    – FromBaidu
    Commented Aug 31, 2013 at 13:27
  • $\begingroup$ This is the code of pic1 $\endgroup$
    – FromBaidu
    Commented Aug 31, 2013 at 13:27
  • 2
    $\begingroup$ The equivalent of imshow is Image, not DensityPlot. DensityPlot calculates a function, Image constructs an image form a matrix. $\endgroup$
    – Szabolcs
    Commented Aug 31, 2013 at 19:16
  • $\begingroup$ If you clarify your question a bit or describe your application, I'll update (or remove) my answer. I'm not sure it answers as it is. $\endgroup$
    – Szabolcs
    Commented Aug 31, 2013 at 20:01

4 Answers 4

13
$\begingroup$

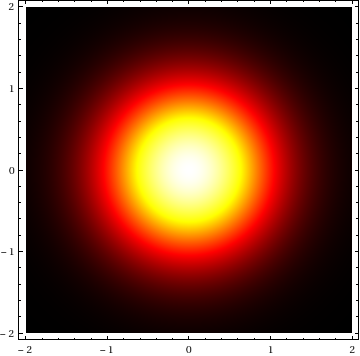
Blend gives smooth transition between a list of colors:

cf[v_] := Blend[{Black, Red, Yellow, White}, v]
DensityPlot[Exp[-x^2 - y^2], {x, -2, 2}, {y, -2, 2}, ColorFunction -> cf, PlotPoints -> 300]

densityplot

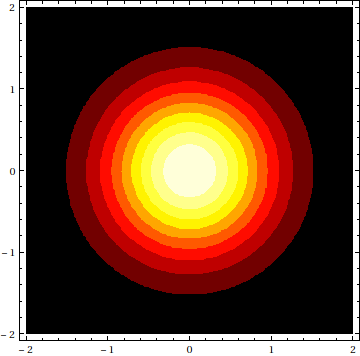
For a clear distinction between some set of contours you can use ContourPlot:

ContourPlot[Exp[-x^2 - y^2], {x, -2, 2}, {y, -2, 2},
 ColorFunction -> cf,
 ContourStyle -> None]

contourplot

If you start out with a matrix of data like you would for imshow you can use ArrayPlot:

data = Table[Exp[-x^2 - y^2], {x, -2, 2, 0.02}, {y, -2, 2, 0.02}];
ArrayPlot[data, ColorFunction -> cf, Frame -> False]

arrayplot

$\endgroup$
0
8
$\begingroup$

Alternatively:

newcolor = 
  RGBColor /@ {{0, 0, 0}, {0.2`, 0, 0}, {0.4`, 0, 0}, {0.6`, 0, 0},
  {0.8`, 0, 0}, {1, 0, 0}, {1, 0.2`, 0}, {1, 0.4`, 0},
  {1, 0.6`, 0}, {1, 0.8`, 0}, {1, 1, 0}, {1, 1, 0.2`},
  {1, 1, 0.4`}, {1, 1, 0.6`}, {1, 1, 0.8`}, {1, 1, 1}};

dat = With[{y = Range[-2, 2, .04]}, Table[Exp[-x^2 - y^2], {x, y}]];
ListDensityPlot[dat, ColorFunction -> (Blend[newcolor, #] &)]


dat = With[{y = Range[-2, 2, .01]}, Table[Exp[-x^2 - y^2], {x, y}]];
Colorize[Image[Rescale@dat], ColorFunction -> (Blend[newcolor, #] &)]

Note:

dat1 = Table[ Exp[-x^2 - y^2], {x, -2, 2, 0.002}, {y, -2, 2, 0.002}]; // Timing
dat2 = With[{y = Range[-2, 2, .002]},  Table[Exp[-x^2 - y^2], {x, y}]]; // Timing
dat1 == dat2
(*
{0.904806, Null}

{0.202801, Null}

True
*)
$\endgroup$
3
  • $\begingroup$ Nice note regarding vectorization. $\endgroup$
    – Mr.Wizard
    Commented Sep 1, 2013 at 23:43
  • $\begingroup$ With is better than Table! WA! $\endgroup$
    – FromBaidu
    Commented Sep 2, 2013 at 5:21
  • 1
    $\begingroup$ FWIW, dat3 = Outer[Times, #, #] &@ Exp[-Range[-2, 2, 0.002]^2] is a bit faster (taking even more advantage of the function at hand). $\endgroup$
    – Michael E2
    Commented Sep 2, 2013 at 15:03
7
$\begingroup$

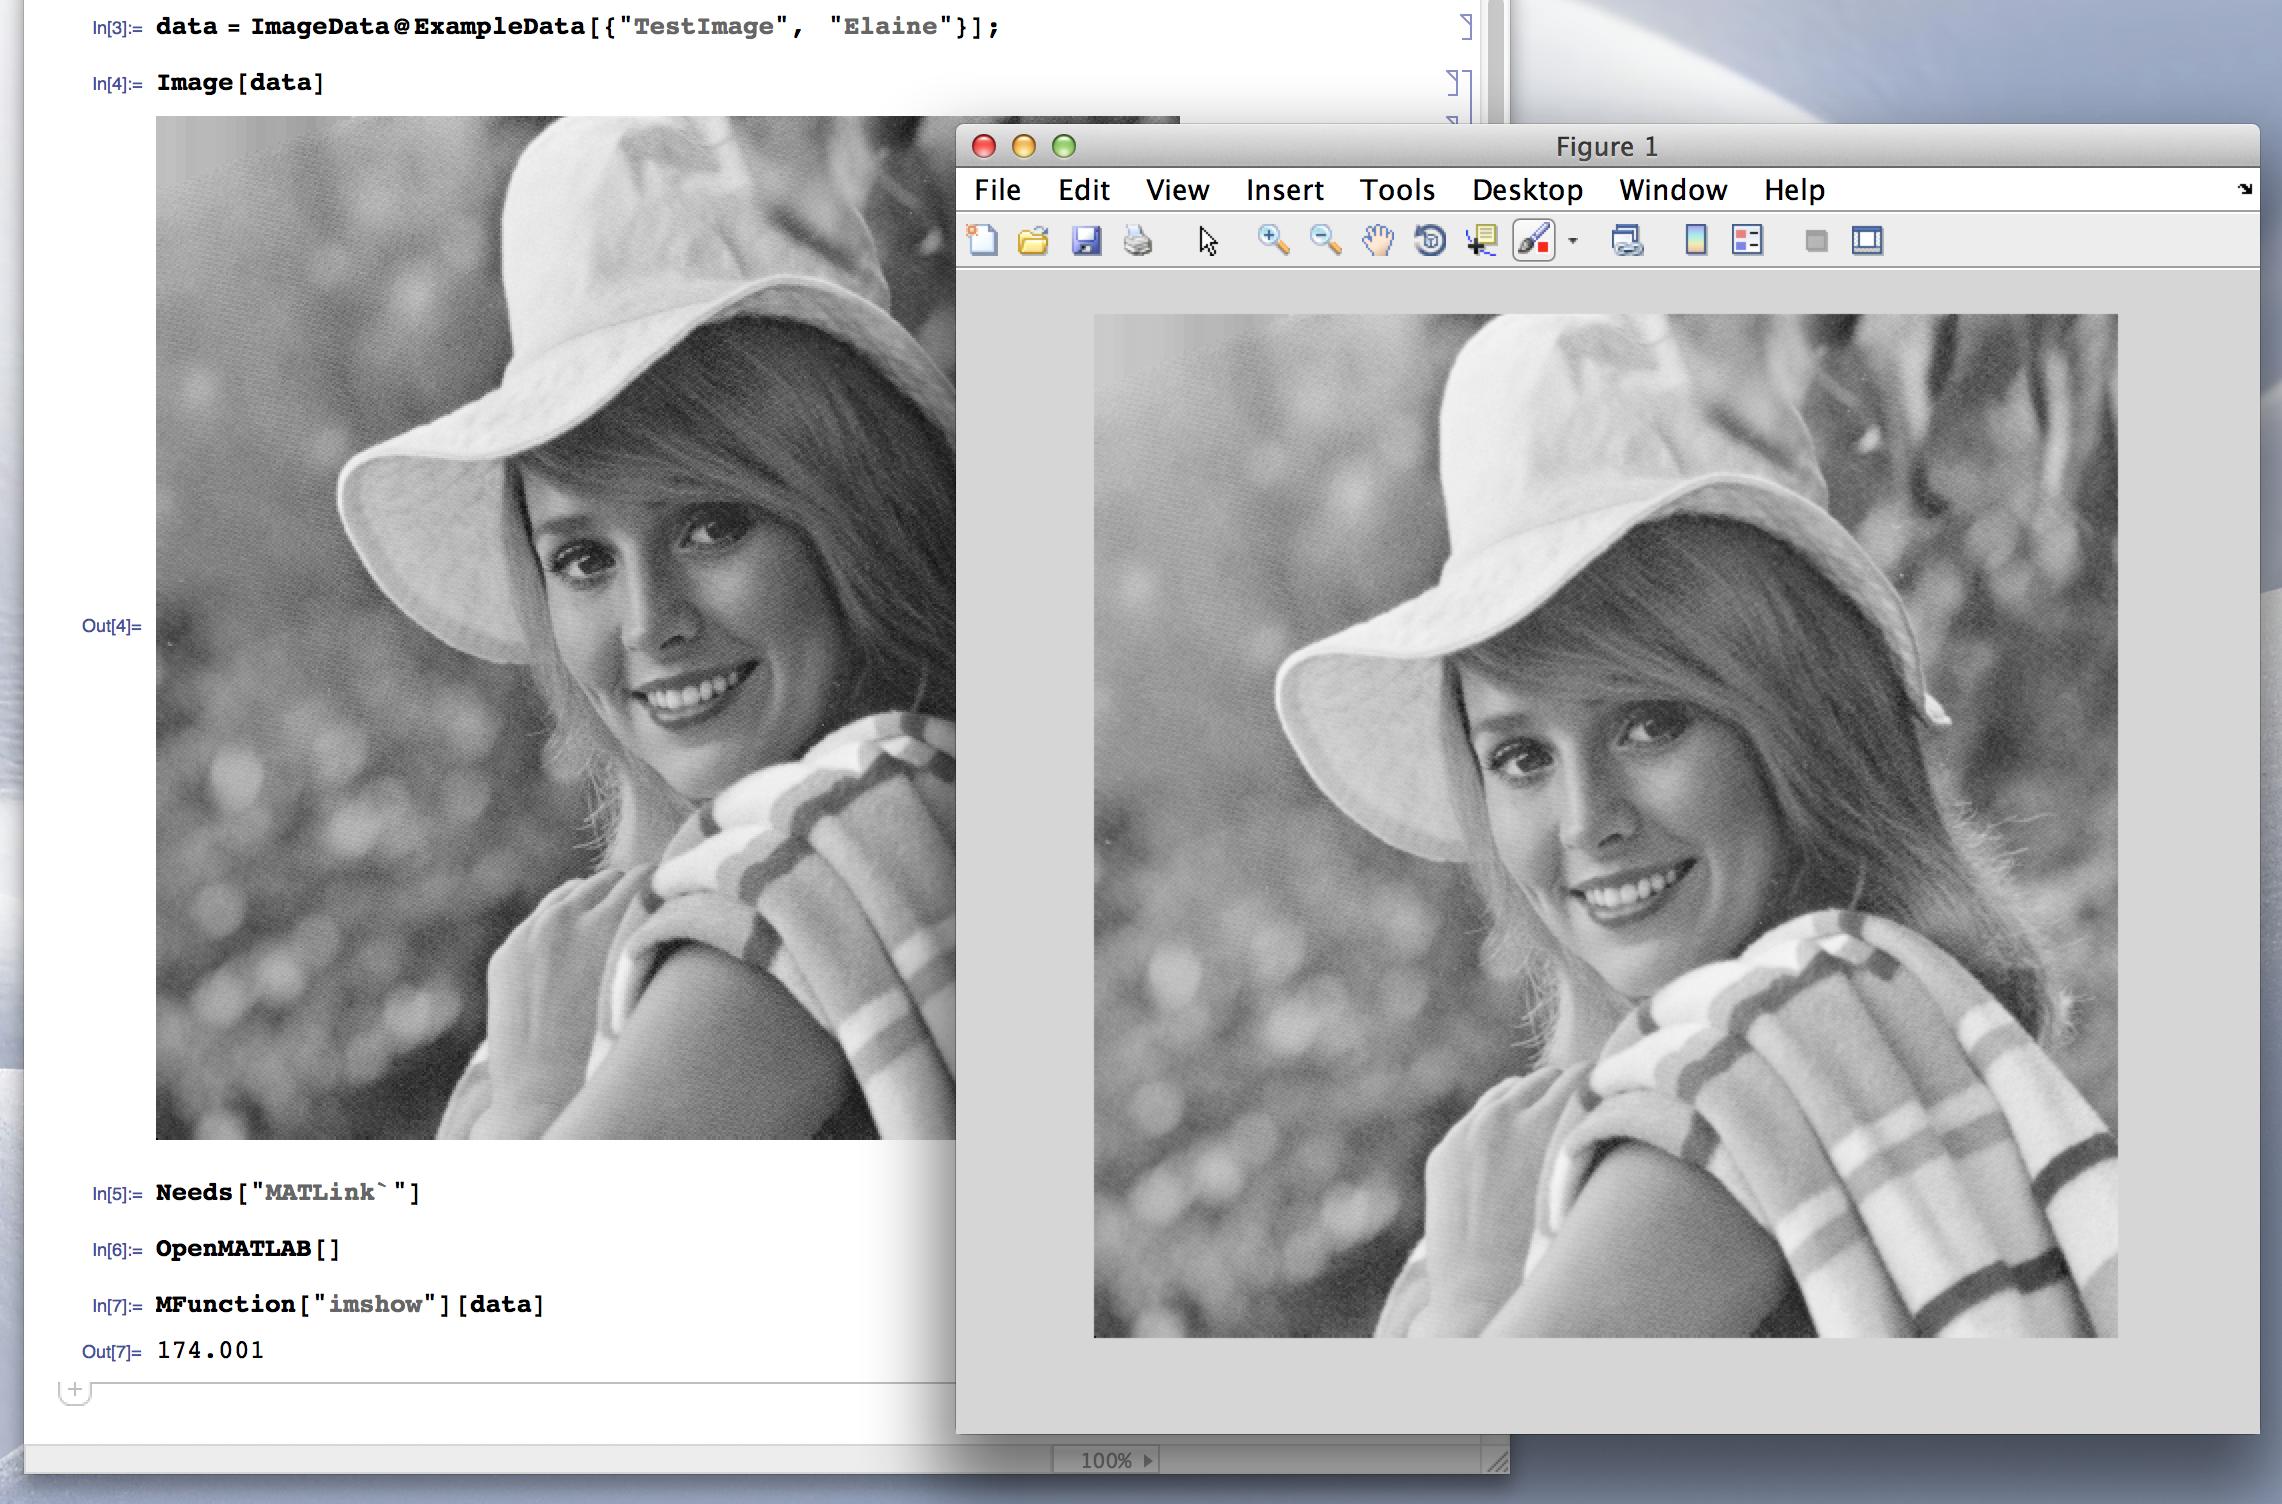
Your question is a bit confusing to me because imshow and DensityPlot do different things. imshow will take a matrix of values and show it as an image. The Mathematica equivalent is Image. DensityPlot will take a two-argument function and plot it in 2D.

Here's a direct comparison (using MATLink to pass the data to MATLAB, for convenience):

MATLAB-and-Mathematica

If you need to use an alternative colour scheme, you can map the corresponding function to the data to generate RGB values, and construct the image afterwards:

Image@Map[List @@ ColorData["Rainbow"][#] &, data, {2}]

Update: Colorize[Image[data], ColorFunction -> "Rainbow"] is better (thanks to @chyanog!)

enter image description here

If the input matrix has a smooth gradation of values, so will the image (provided that the colours scheme is smooth---most of them are).

$\endgroup$
3
  • 4
    $\begingroup$ Elaine is cuter then Lena. +1 $\endgroup$
    – Öskå
    Commented Aug 31, 2013 at 19:40
  • 1
    $\begingroup$ Colorize[img, ColorFunction -> "Rainbow"] would be more faster. $\endgroup$
    – chyanog
    Commented Sep 1, 2013 at 7:01
  • 1
    $\begingroup$ Be careful with doing Colorize[Image[data], ColorFunction->...] you lose the normalization step: data = Table[ 100 Exp[-x^2 - y^2], {x, -2, 2, 0.02}, {y, -2, 2, 0.02}]; Colorize[Image[#], ColorFunction -> "Rainbow"] & /@ {data, data/Max[data]} and not even ColorFunctionScaling->True will help $\endgroup$
    – ssch
    Commented Sep 2, 2013 at 14:34
1
$\begingroup$

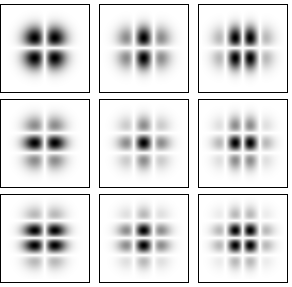
Here is my way to simulink a Gauss beam:

 H[m_, x_] := (-1)^m*D[Exp[-x^2], {x, m}];

 Table[ArrayPlot[Table[Evaluate[H[i, x] H[j, y]],
                       {x, -3, 3, .005}, {y, -3, 3, .005}]
                ]
      , {i, 1, 3}, {j, 1, 3}] // MatrixForm

Gauss beam Simulink

$\endgroup$

Your Answer

By clicking “Post Your Answer”, you agree to our terms of service and acknowledge you have read our privacy policy.

Not the answer you're looking for? Browse other questions tagged or ask your own question.