Alternatively:
newcolor =
  RGBColor /@ {{0, 0, 0}, {0.2`, 0, 0}, {0.4`, 0, 0}, {0.6`, 0, 0},
  {0.8`, 0, 0}, {1, 0, 0}, {1, 0.2`, 0}, {1, 0.4`, 0},
  {1, 0.6`, 0}, {1, 0.8`, 0}, {1, 1, 0}, {1, 1, 0.2`},
  {1, 1, 0.4`}, {1, 1, 0.6`}, {1, 1, 0.8`}, {1, 1, 1}};

dat = With[{y = Range[-2, 2, .04]}, Table[Exp[-x^2 - y^2], {x, y}]];
ListDensityPlot[dat, ColorFunction -> (Blend[newcolor, #] &)]


dat = With[{y = Range[-2, 2, .01]}, Table[Exp[-x^2 - y^2], {x, y}]];
Colorize[Image[Rescale@dat], ColorFunction -> (Blend[newcolor, #] &)]
Note:
dat1 = Table[ Exp[-x^2 - y^2], {x, -2, 2, 0.002}, {y, -2, 2, 0.002}]; // Timing
dat2 = With[{y = Range[-2, 2, .002]},  Table[Exp[-x^2 - y^2], {x, y}]]; // Timing
dat1 == dat2
(*
{0.904806, Null}

{0.202801, Null}

True
*)

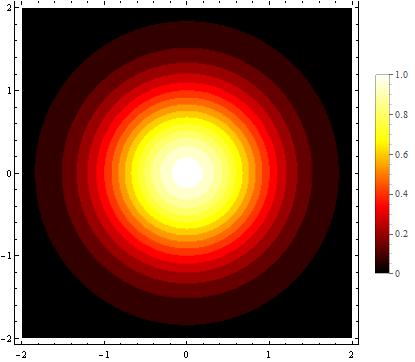
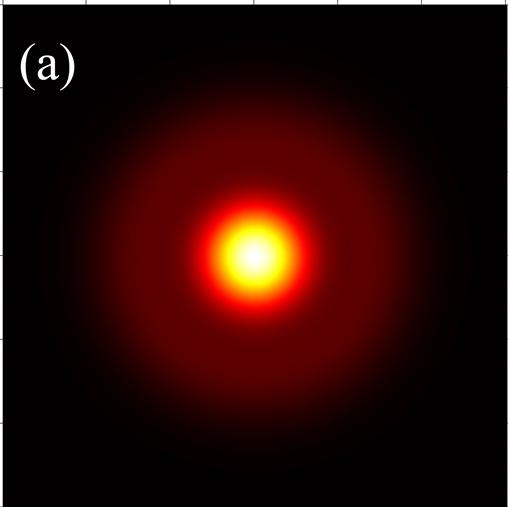
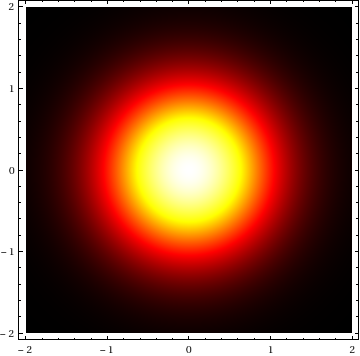
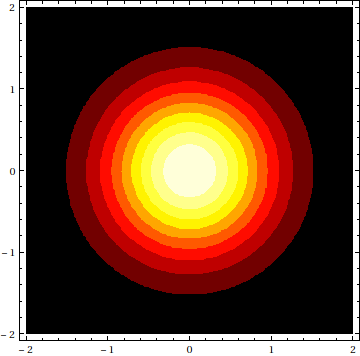
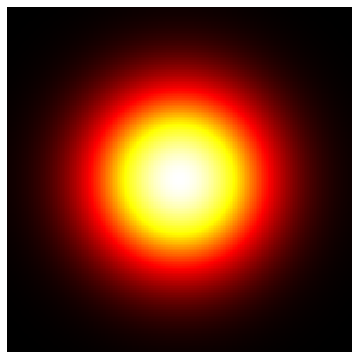

newcolor2 = {RGBColor[0, 0, 0], RGBColor[0.2, 0, 0], RGBColor[0.4, 0, 0], RGBColor[0.6, 0, 0], RGBColor[0.8, 0, 0], RGBColor[1, 0, 0], RGBColor[1, 0.2, 0], RGBColor[1, 0.4, 0], RGBColor[1, 0.6, 0], RGBColor[1, 0.8, 0], RGBColor[1, 1, 0], RGBColor[1, 1, 0.2], RGBColor[1, 1, 0.4], RGBColor[1, 1, 0.6], RGBColor[1, 1, 0.8], RGBColor[1, 1, 1]};DensityPlot[Exp[-x^2 - y^2], {x, -2, 2}, {y, -2, 2}, ColorFunction -> newcolor2, PlotLegends -> Automatic, PlotPoints -> 300]$\endgroup$imshowisImage, notDensityPlot.DensityPlotcalculates a function,Imageconstructs an image form a matrix. $\endgroup$