2
$\begingroup$

Let $$\eta=x \cos a+y \sin a,\quad\zeta=-x \sin a+y \cos a,\quad 0<a<\pi/2$$

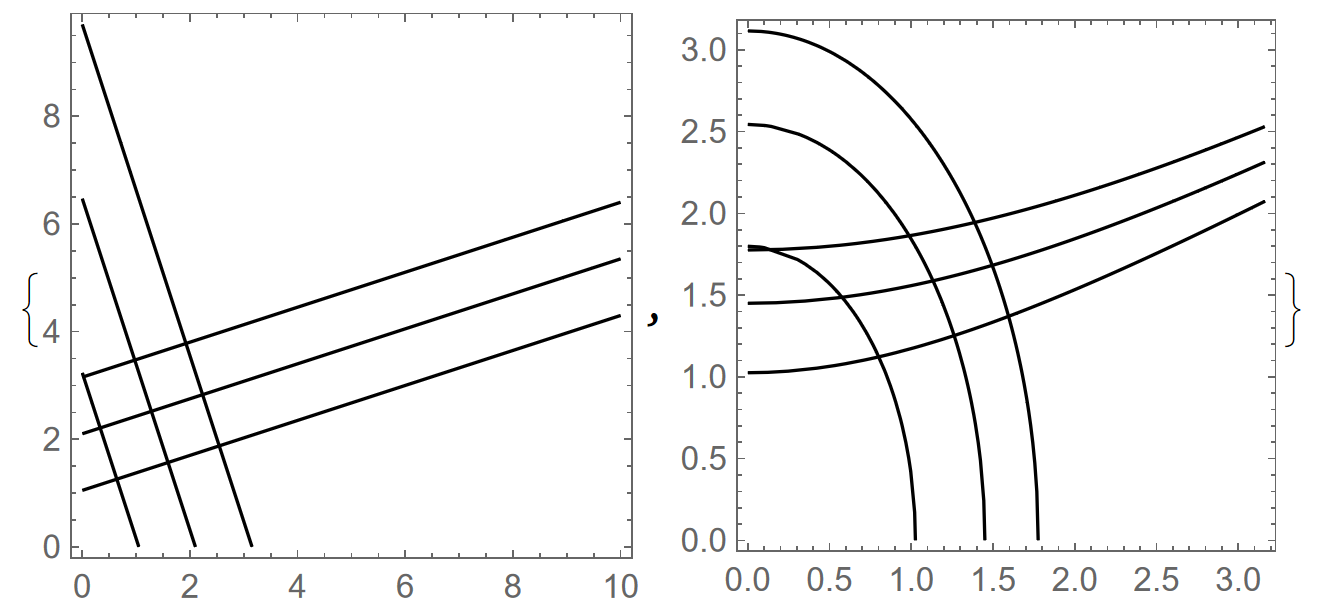
For fixed $a$, the coordinate lines for $\eta=1,2,3, etc$ are the parallel straight lines going from down-right to up-left in x-y plane. The coordinate lines for $\zeta=-3,-2,-1,0,1,2,3, etc$ are the parallel straight lines going from down-left to up-right in x-y plne.

Supposed that I am only interested in those lines in the first quadrant of x-y plane: $(x>0,y>0)$.

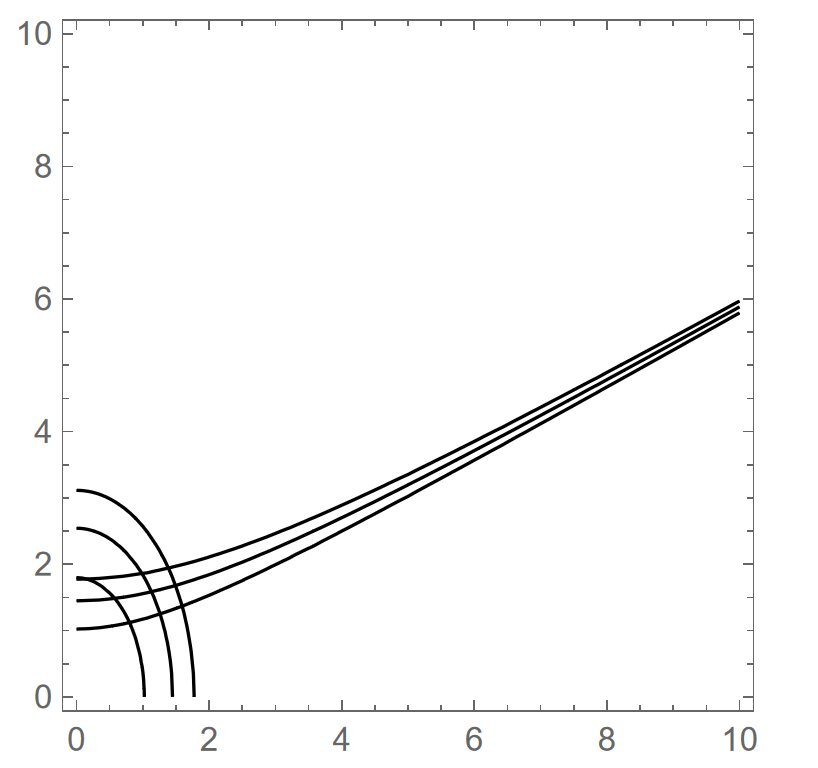
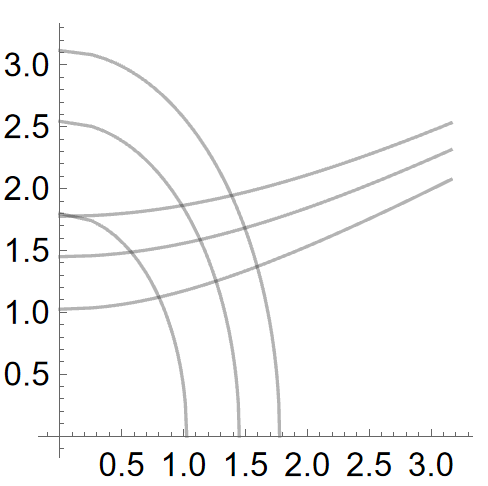
Let $(x_1=\sqrt{x},x_2=\sqrt{y}$. How those lines will look like in the first quadrant of the $x_1-x_2$ plane?

Thanks a lot!

$\endgroup$

2 Answers 2

4
$\begingroup$
Clear["Global`*"];
a = .3*2 π;
η = x*Cos[a] + y*Sin[a];
ζ = -x*Sin[a] + y*Cos[a];
g = Show[
   ContourPlot[η, {x, 0, 10}, {y, 0, 10}, Contours -> {1, 2, 3}, 
    ContourShading -> None], 
   ContourPlot[ζ, {x, 0, 10}, {y, 0, 10}, 
    Contours -> Range[-3, 3], ContourShading -> None], 
   PlotRange -> All, AspectRatio -> Automatic];
{g, g /. {x_Real, y_Real} :> {Sqrt[x], Sqrt[y]}}

enter image description here

  • or
a = .3*2 π;
Show[ContourPlot[
  x*Cos[a] + y*Sin[a] /. {x -> x^2, y -> y^2} // Evaluate, {x, 0, 
   10}, {y, 0, 10}, Contours -> {1, 2, 3}, ContourShading -> None], 
 ContourPlot[-x*Sin[a] + y*Cos[a] /. {x -> x^2, y -> y^2} // 
   Evaluate, {x, 0, 10}, {y, 0, 10}, 
  Contours -> {-3, -2, -1, 0, 1, 2, 3}, ContourShading -> None]]

enter image description here

  • or
a = .3*2 π;
η = x*Cos[a] + y*Sin[a];
ζ = -x*Sin[a] + y*Cos[a]; 
ParametricPlot[{Sqrt[x], Sqrt[y]}, {x,
   0, 10}, {y, 0, 10}, 
 MeshFunctions -> {Function[{x1, y1, x, y}, η], 
   Function[{x1, y1, x, y}, ζ]}, 
 Mesh -> {{1, 2, 3}, {-3, -2, -1, 0, 1, 2, 3}}, PlotPoints -> 150, 
 MaxRecursion -> 6, PlotStyle -> None, Frame -> False, 
 BoundaryStyle -> None]

enter image description here

$\endgroup$
2
  • $\begingroup$ Thank you so much! $\endgroup$
    – mike
    Commented Nov 19 at 14:26
  • $\begingroup$ After I set a=pi/4<pi/2, the plots look like what I expected to see. Thanks again. $\endgroup$
    – mike
    Commented Nov 19 at 14:56
2
$\begingroup$

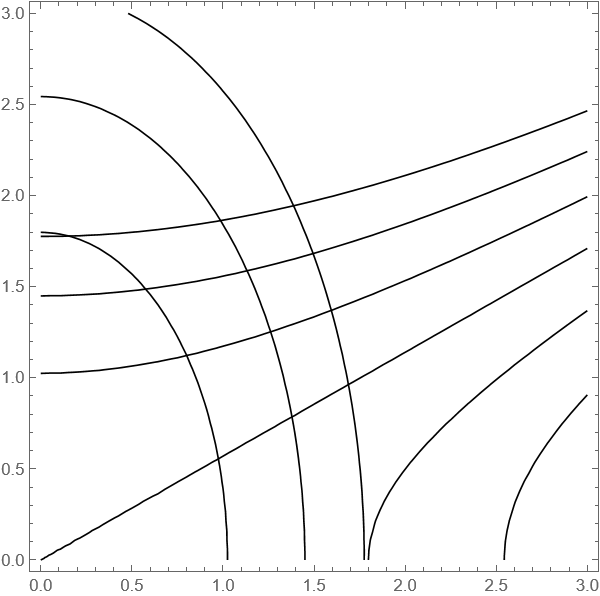
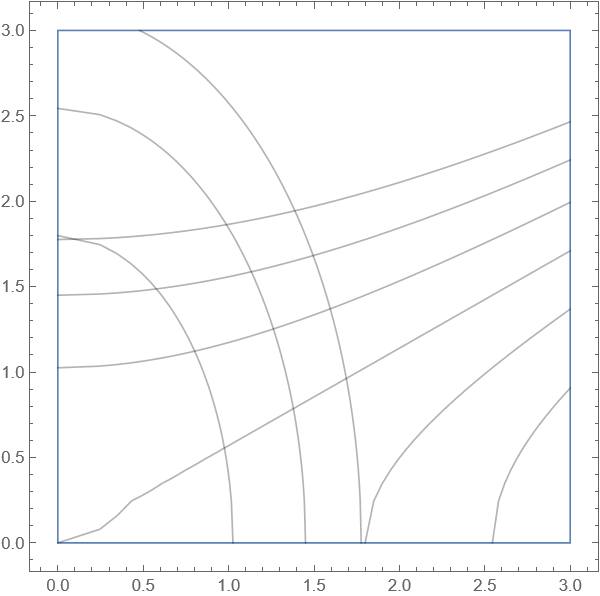
This is an extended comment. ContourPlot seems to be best rendering compared with ParametricPlot:

m[a_] := {{Cos[a], Sin[a]}, {-Sin[a], Cos[a]}};
ContourPlot[
 m[0.3 2 Pi] . {u, v} /. {u -> x^2, v -> y^2}, {x, 0, 3}, {y, 0, 3}, 
 Contours -> Range[-3, 3], ContourShading -> None]
ParametricPlot[{Sqrt[x], Sqrt[y]}, {x, 0, 9}, {y, 0, 9}, 
 MeshFunctions -> {Function[{u, v, x, y}, First[m[0.3 
        2 Pi] . {x, y}]], Function[{u, v, x, y}, Last[m[0.3 
        2 Pi] . {x, y}]]}, Mesh -> {Range[-3, 3], Range[-3, 3]}, 
 PlotStyle -> None, PlotPoints -> 150, MaxRecursion -> 6]

Noting:

  • coordinate transform is just a rotation
  • I am using a used by @cvgmt for comparison (though using more contours/mesh values)

enter image description here

enter image description here

$\endgroup$
1
  • $\begingroup$ ParametricPlot needs more points and more MaxRecursion, I don't know why $\endgroup$
    – cvgmt
    Commented Nov 20 at 13:33

Your Answer

By clicking “Post Your Answer”, you agree to our terms of service and acknowledge you have read our privacy policy.

Not the answer you're looking for? Browse other questions tagged or ask your own question.