2
$\begingroup$

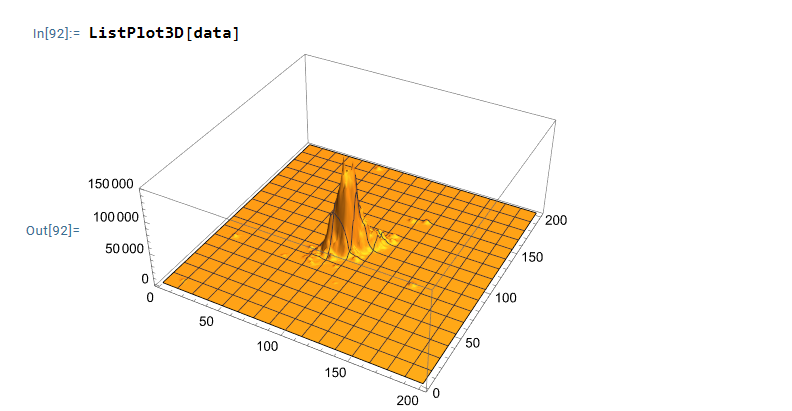
I have a dataset which is a moderately large (1200x1200) array of values. A part of that array has the data that is gaussian along the 2 diagonals. Find the general area of the peak is trivial with a binarize. But then I'm trying to find the actual peak center that obeys a normal on both axes.

Sample data here https://pastebin.com/MaEkwBwf

an image of the dataset

I'm trying to get a fit for that but I don't have a good grasp on how to pass the aray to NonLinearModelFit

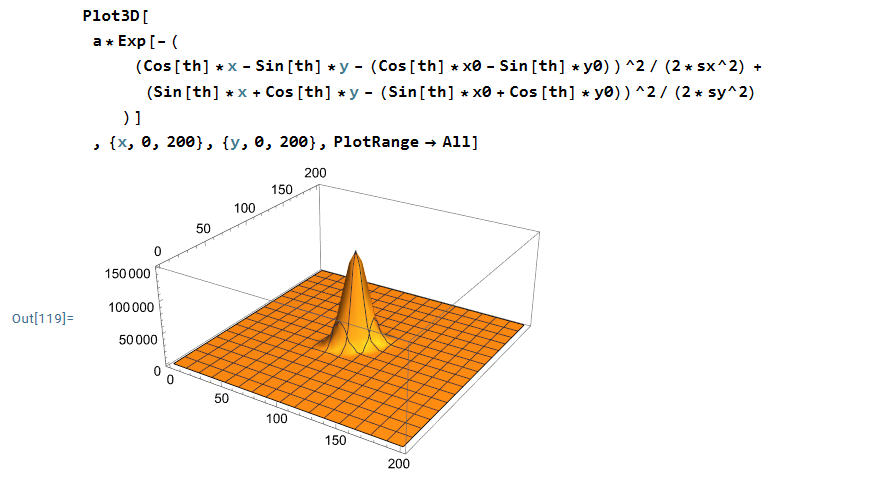
The function I'm trying to fit is

a = 150000;
x0 = 100;
y0 = 100;
sx = 5;
sy = 10;
th = Pi/4;
Plot3D[
 a*Exp[-(
     (Cos[th]*x - Sin[th]*y - (Cos[th]*x0 - Sin[th]*y0))^2/(2*
         sx^2) + (Sin[th]*x + 
          Cos[th]*y - (Sin[th]*x0 + Cos[th]*y0))^2/(2*sy^2)
     )]
 , {x, 0, 200}, {y, 0, 200}, PlotRange -> All]

In this case the free parameters would be a, x0, y0, sx, sy, th

enter image description here

NonlinearModelFit[
 data,
 a*Exp[-(
     (Cos[th]*x - Sin[th]*y - (Cos[th]*x0 - Sin[th]*y0))^2/(2*
         sx^2) + (Sin[th]*x + 
          Cos[th]*y - (Sin[th]*x0 + Cos[th]*y0))^2/(2*sy^2)
     )],
 {a, x0, y0, sx, sy, th},
 {x, y}]

NonlinearModelFit::Number of coordinates (200) is not equal to the number of variables (2).
$\endgroup$
8
  • $\begingroup$ Your dataset is consistent with the values being counts (i.e., non-negative integers). Is that from some random sample? Or are those measurements that were rounded to integers? If the former, you should not be using NonlinearModelFit and you should sue whoever taught you to consider that. $\endgroup$
    – JimB
    Commented Nov 18 at 16:59
  • $\begingroup$ Yes these are events of ion impacts on a detector and recorded by a CMOS camera. However the impacts are larger than 1 pixel. I'm trying to find the center of the distribution, and the properties of the distribution. $\endgroup$
    – A postdoc
    Commented Nov 18 at 17:08
  • $\begingroup$ I'm not understanding where the sines and cosines come from as that's not a standard way to define a bivariate normal function. However, if you're willing/able to assume a bivariate normal function for the counts, then just finding the horizontal and vertical means will get you the location of the peak. No need to determine the orientation of the bivariate surface (if that's what the sines and cosines are for). $\endgroup$
    – JimB
    Commented Nov 18 at 17:58
  • $\begingroup$ For experimental reasons the particules measured propagate at 45° of the camera sensor array. I want to measure the angle and the distribution across the propagation axis (the long axis) and across it (short axis). Any significant deviation from 45° mean there is an issue. $\endgroup$
    – A postdoc
    Commented Nov 18 at 18:03
  • $\begingroup$ @JimB Why is NonlinearModelFit not appropriate for camera counts? Or do you mean if they are from a random sample it's incorrect? Can you elucidate? $\endgroup$ Commented Nov 19 at 1:03

3 Answers 3

2
$\begingroup$

This is an extended "question" about the generation of the data and a comment about the regression approach.

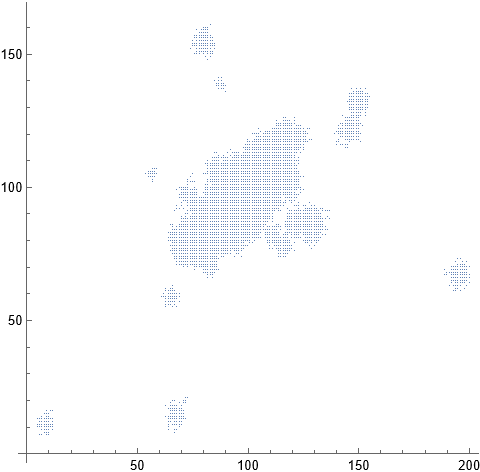
You mention in a comment that "the impacts are larger than 1 pixel." If one plots just the values where the count is greater than zero, one sees the following:

wData = Flatten[Table[{i - 1, j - 1, data[[i, j]]}, {i, 1, 201}, {j, 1, 201}], 1];
wData = Select[wData, #[[3]] > 0 &];
ListPlot[wData[[All, {1, 2}]], AspectRatio -> 1]

Areas of non-zero counts

Are the "blobs" of an approximately 10-pixel diameter isolated impacts? With the larger blob in the center representing multiple and overlapping impacts? Do you only have the resulting total counts or do you have the counts for each impact?

I ask these questions because (1) The pattern does not seem to be bivariate Gaussian, (2) the outlying "impacts" can have a strong influence on the estimates and (3) your approach does not provide (so far) estimates of precision for the central location nor for the angle.

$\endgroup$
2
  • $\begingroup$ And if the impacts are all of similar size, then it appears that there are around 500 impacts. $\endgroup$
    – JimB
    Commented Nov 18 at 22:58
  • $\begingroup$ "Are the "blobs" of an approximately 10-pixel diameter isolated impacts?" > Yes "With the larger blob in the center representing multiple and overlapping impacts?" > also yes. I cannot generally get individual counts for the center as there are too many events accumulating there. $\endgroup$
    – A postdoc
    Commented Nov 19 at 13:50
1
$\begingroup$

I have managed to figure it out, posting in case that helps someone later. I had to flatten the data in the form of response = f(x,y)

dataflat = Flatten[Table[{i, j, data[[i, j]]}, {i, 1, 200}, {j, 1, 200}], 1];
model = NonlinearModelFit[
  dataflat,
  a*Exp[-(
      (Cos[th]*x - Sin[th]*y - (Cos[th]*x0 - Sin[th]*y0))^2/(2*
          sx^2) + (Sin[th]*x + 
           Cos[th]*y - (Sin[th]*x0 + Cos[th]*y0))^2/(2*sy^2)
      )],
  {{a, 150000}, {x0, 100}, {y0, 100}, {sx, 3}, {sy, 3}, th}, {x, y}]

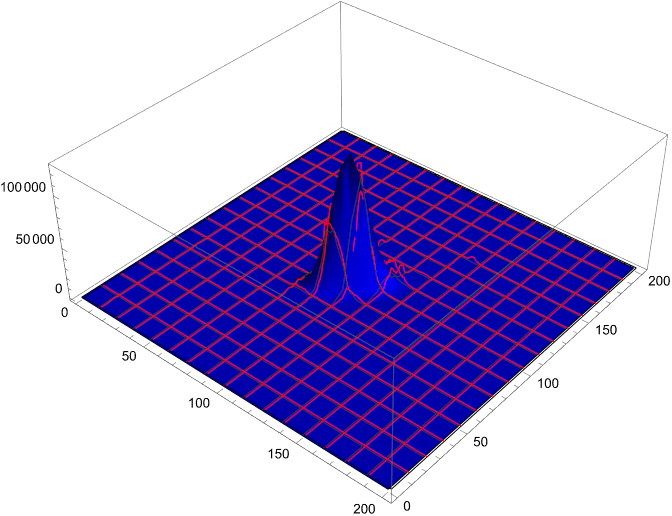
Produces a fit

Show[{
  Plot3D[model[x, y], {x, 0, 200}, {y, 0, 200}, PlotRange -> All, 
   PlotStyle -> Blue],
  ListPlot3D[data, PlotStyle -> None, MeshStyle -> Red]
  }]

result of the plot with the data and the fit

The colors are terrible, but it fits correctly and identifies the 45° correctly (in that example the fit outputs 46.4°)

$\endgroup$
1
  • 1
    $\begingroup$ You data has dimensions of 201 x 201 which suggests you want to use {i, 1, 201} rather than {i, 1, 200} in your code. While that doesn't change the estimate of the angle using your approach, it does drop off one row and one column. $\endgroup$
    – JimB
    Commented Nov 18 at 21:06
1
$\begingroup$

Here's an approach using an estimate of the covariance matrix.

(* Get positive counts and grid location *)
wData = Flatten[Table[{i - 1, j - 1, data[[i, j]]}, {i, 1, 201}, {j, 1, 201}], 1];
wData = Select[wData, #[[3]] > 0 &];  (* Only keep counts greater than zero to speed things up *)

(* Calculate means, variances, and covariance *)
m1 = wData[[All, 1]] . wData[[All, 3]]/Total[wData[[All, 3]]];
m2 = wData[[All, 2]] . wData[[All, 3]]/Total[wData[[All, 3]]];
v1 = Sum[(wData[[i, 1]] - m1)^2  wData[[i, 3]], {i, 1, Length[wData]}]/Total[wData[[All, 3]]];
v2 = Sum[(wData[[i, 2]] - m2)^2  wData[[i, 3]], {i, 1, Length[wData]}]/Total[wData[[All, 3]]];
cov = Sum[(wData[[i, 1]] - m1) (wData[[i, 2]] - m2) wData[[i, 3]],
 {i, 1, Length[wData]}]/Total[wData[[All, 3]]];

(* Construct estimate of covariance matrix *)
covMatrix = {{v1, cov}, {cov, v2}};
(* Compute the eigenvalues and eigenvectors *)
{eigenvalues, eigenvectors} = Eigensystem[covMatrix];
(* Identify the eigenvector corresponding to the largest eigenvalue *)
maxEigenvalueIndex = Ordering[eigenvalues, -1][[1]];
eigenvector = eigenvectors[[maxEigenvalueIndex]];
(* Calculate the angle in degrees *)
angle = (180/Pi) ArcTan[eigenvector[[1]], eigenvector[[2]]]
(* 39.8213 *)

The estimate of the peak location is just {m1, m2}. Unfortunately, the only way I know of to calculate a measure of precision for the estimated angle is using a bootstrap approach. But that would require knowing the individual impacts to be appropriate. An appropriate bootstrap measure of precision for the peak location would also require knowing the individual impacts.

$\endgroup$
3
  • 1
    $\begingroup$ FWIW, you can just create an empirical distribution dist = EmpiricalDistribution[wData[[All, 3]] -> wData[[All, 1 ;; 2]]]; and then calculate the mean and covariance μ = Mean@dist; Σ = Covariance@dist; $\endgroup$
    – ydd
    Commented Nov 19 at 2:00
  • $\begingroup$ Actually I take this back, the means agree but the covariance of my suggestion differs. $\endgroup$
    – ydd
    Commented Nov 19 at 2:04
  • $\begingroup$ @ydd You're first comment was correct. I had the wrong index value for estimating the the second variance. That is now fixed land the estimates for the covariance match (although it didn't change the estimate of the angle by very much). $\endgroup$
    – JimB
    Commented Nov 19 at 4:25

Your Answer

By clicking “Post Your Answer”, you agree to our terms of service and acknowledge you have read our privacy policy.

Not the answer you're looking for? Browse other questions tagged or ask your own question.