I want to plot my graph in a certain ratio(2:1), for example, 400*200(Width * Height).
I tried ImageSize:
GraphPlot[{2 -> 1, 2 -> 0, 3 -> 2, 3 -> 1, 4 -> 2, 4 -> 3, 5 -> 3,
  5 -> 4}, DirectedEdges -> True, VertexLabels -> "Name",
 ImageSize -> {400, 200}]
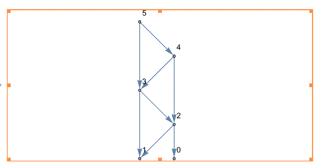
And outputs:
Mathematica just put my graph in the middle of the picture and it doesn't fit well
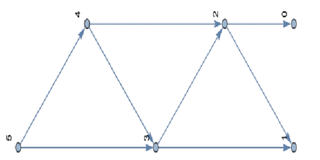
And then I tried ImageRotate and ImageResize:
ImageResize[
 ImageRotate[
  GraphPlot[{2 -> 1, 2 -> 0, 3 -> 2, 3 -> 1, 4 -> 2, 4 -> 3, 5 -> 3,
    5 -> 4}, DirectedEdges -> True, VertexLabels -> "Name"],
  90 Degree], {400, 200}]
But the label is rotated also.
How can I output my graph in a 400*200 picture and fit well?
Edit:
GraphPlot[{2 -> 1, 2 -> 0, 3 -> 2, 3 -> 1, 4 -> 2, 4 -> 3, 5 -> 3,
  5 -> 4}, DirectedEdges -> True, VertexLabels -> "Name",
 AspectRatio -> 1/2]
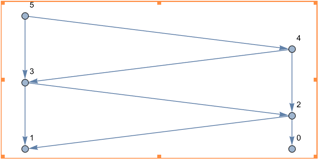
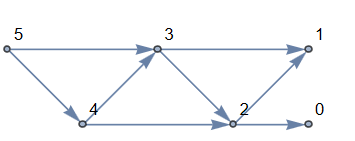
It appears to fit but in a strange way. I want to make it better and like this:



AspectRatio? $\endgroup$AspectRatio -> 1$\endgroup$AspectRatio -> 1/2$\endgroup$GraphLayout -> "DiscreteSpiralEmbedding"$\endgroup$