2
$\begingroup$

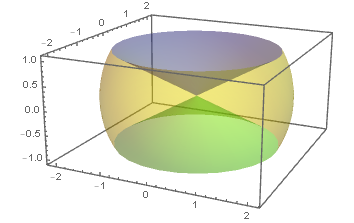
I am having difficulties getting 3d plots to display correctly. For reference, I am trying to plot regions with the surfaces being different colors to help students visualize the bounds on their triple integrals. If I plot each of the following separately, they display just fine. When I plot all of them, the bottom cone is only partially shown and the portion of the sphere shows only the top half and has weird patches removed.

cylinderPlot3D[f_, {rMin_, rMax_}, {tMin_, tMax_}, opts___] := 
ParametricPlot3D[{r Cos[t], r Sin[t], f[r, t]}, {r, rMin, rMax}, {t, 
tMin, tMax}, opts]
f1[r_, t_] := r/Sqrt[3]; f2[r_, t_] := -r/Sqrt[3];
P1 = cylinderPlot3D[f1, {0, Sqrt[3]}, {0, 2 Pi}, Mesh -> None, 
PlotStyle -> Blue];
P2 = cylinderPlot3D[f2, {0, Sqrt[3]}, {0, 2 Pi}, Mesh -> None, 
PlotStyle -> Green]; 
P3 = ParametricPlot3D[{2*Sin[p]*Cos[t], 2*Sin[p]*Sin[t], 2*Cos[p]}, {p, 
Pi/3, 2*Pi/3}, {t, 0, 2*Pi}, Mesh -> None];
Show[P1, P2, P3]

cylinder plot

$\endgroup$
0

2 Answers 2

2
$\begingroup$
  • PlotRange->All
  • We can use RevolutionPlot3D to do the cylinder coordinate plot3d.
p12 = RevolutionPlot3D[
   f1[r, t], {r, -Sqrt[3], Sqrt[3]}, {t, 0, 2 π}, 
   PlotRange -> All, BoxRatios -> Automatic, MeshFunctions -> {#3 &}, 
   MeshShading -> {Green, Lighter@Blue}, Mesh -> {{0}}, 
   BoundaryStyle -> None];
p3 = RevolutionPlot3D[{2 Sin[p], 2 Cos[p]}, {p, π/3, 
    2 π/3}, {t, 0, 2 π}, MeshStyle -> None, 
   PlotPoints -> 80];
Show[p12, p3, PlotRange -> All, Boxed -> False, Axes -> False, 
 BoxRatios -> Automatic]

enter image description here

  • Calculate the volume
r = 2;
reg = ParametricRegion[{1 - s, s} . {{0, 0, 0}, 
    FromSphericalCoordinates[{r, θ, φ}]}, {{s, 0, 
    1}, {θ, π/3, (2 π)/3}, {φ, 0, 2 π}}]
reg//Region

(16 π)/3

$\endgroup$
1
$\begingroup$

You can use Opacity:

P1 = cylinderPlot3D[f1, {0, Sqrt[3]}, {0, 2 Pi}, Mesh -> None, 
   PlotStyle -> Opacity[0.3, Blue]];
P2 = cylinderPlot3D[f2, {0, Sqrt[3]}, {0, 2 Pi}, Mesh -> None, 
   PlotStyle -> Opacity[0.3, Green]];
P3 = ParametricPlot3D[{2*Sin[p]*Cos[t], 2*Sin[p]*Sin[t], 
    2*Cos[p]}, {p, Pi/3, 2*Pi/3}, {t, 0, 2*Pi}, Mesh -> None, 
   PlotStyle -> Opacity[0.3, Yellow]];

Show[P1, P2, P3
 , PlotRange -> All
 , Lighting -> {{"Ambient", White}}
 ]

Cylinders using opacity

$\endgroup$

Your Answer

By clicking “Post Your Answer”, you agree to our terms of service and acknowledge you have read our privacy policy.

Not the answer you're looking for? Browse other questions tagged or ask your own question.