-2
$\begingroup$

The hyperbolic paraboloid is notoriously hard to visualize. One to do so is via cylindrical coordinates $$z = r^2 \cos 2 \theta$$ which suggest the following 3D visualization:

  1. Start with a parabola pointing up. The parabola is a 2D figure, and we are looking straight at it.
  2. Revolve it slowly, bending its arms down as it revolves, so that by the time its rotated 45°, its arms are flat, forming a straight line.
  3. Keep revolving it and bending it down, so that by the time it's revolved 90°, it's arms point down.
  4. Now keep revolving it, but begin bending it back up, at the same rate.
  5. Continue this, and slowly increase the speed of revolution, so that eventually, when the revolution is fast enough, persistence of vision starts to keep the previous positions in your mind's eye, and you see the shape of the hyperbolic paraboloid form!

Is it possible to do this in Mathematica? Each frame would simply be a plot of $z = r^2 \cos 2 \theta$ for a single fixed $\theta$. The challenge is stringing the frames together into an animation, and playing it at a faster and faster frame rate.

Note: This question is distinct from the general questions of Making mathematical animations with Mathematica and Making mathematical animations with Mathematica , because it is specific to the technique of persistence of vision animations.


Update

Here's the code up to the point where we need to introduce persistence of vision:

n  = 100 (* Number of slices of theta *)
j = 10 (* The slice this frame is showing *)
RevolutionPlot3D[r^2 Cos[2\[Theta]] ,{r, 0,1}, {\[Theta], 2 \[Pi]*j/n, 2\[Pi]*(j+1)/n}]
(* Ideally I'd like Theta to also include {-2 \[Pi]*j/n, -2\[Pi]*(j+1)/n},
but I don't know how to do disjoint ranges *)

So far, so good. But now the question is: How to sweep j through 0 to n-1, initially slowly, then faster, all in the same exact plot frame, so that persistence of vision slurs these images together?

Doing

Animate[RevolutionPlot3D[r^2 Cos[2\[Theta]] ,{r, 0,1}, {\[Theta], 2 \[Pi]*s/n, 2\[Pi]*(s+1)/n}], {s, 0, 99}] 

doesn't work, since the plot frame is redrawn each time.

$\endgroup$
4
  • 1
    $\begingroup$ Is your question about persistence of vision animations, or is it about visualizing a hyperbolic paraboloid? Sorry to ask a stupid sounding question, but it sounds like your main problem is in visualizing something that's "notoriously hard to visualize". If that's the case, then maybe ask for suggestions directly related to visualizing that thing. If your question is about persistence of vision, then would you be satisfied with simple proof-of-concept answers that aren't actually hyperbolic paraboloids? $\endgroup$
    – lericr
    Commented Oct 10 at 3:57
  • $\begingroup$ @leicr The question is about persistence of vision animations. It's recommended for questions to include context, background, and motivation, which is easier to answer than an isolated "How do I do X?!". $\endgroup$ Commented Oct 10 at 4:13
  • $\begingroup$ @lericr Re "would you be satisfied with simple proof-of-concept answers that aren't actually hyperbolic paraboloids," the question specifically does not want the frames to be hyperbolic paraboloids; the whole point is that each frame should just be a simple parabola ($z = r^2$), only bent by $\cos 2 \theta$ (i.e. $z = r^2 \cos 2 \theta$), and only by stringing together via persistence of vision do we get perceive a hyperbolic parabola, even though we never plotted one! $\endgroup$ Commented Oct 10 at 4:13
  • 1
    $\begingroup$ 1. Why plotting just a portion of the surface at each frame should be better than simply plotting the whole surface at once? 2. Can you show as an example of such "persistence of vision animation"? $\endgroup$ Commented Oct 10 at 8:31

4 Answers 4

5
$\begingroup$

Let's break this into two problems. The first is to create a sequence of slices. What you've failed to do is orient your slices in 3D. There are probably several ways to do this, but here's one.

slices = 
  Table[
    ParametricPlot3D[
      {r Cos[t], r Sin[t], r^2 Cos[2 t]}, {r, -1, 1}, 
      PlotRange -> {-1, 1}, Axes -> False, Boxed -> False],
    {t, 0, 2 Pi, 2 Pi/100}];

This creates 100 slices, but you can adjust that as necessary going forward.

The next problem is to put these slices together into an animation. The easiest way would be

ListAnimate[slices]

You could also try FrameListVideo. And you can try Exporting to GIF or MP4 or whatever.

But, you want to be able to control the frame rate. Here we run into a problem, because while that option is available, the animation will need to be regenerated for each frame rate you want to try. So, frame rate changes won't be nice and smooth. But if you don't need smooth transitions between frame rate adjustments, then you can just generate each animation at each frame rate you want.

But now we run into a final problem. I've played around with this, and I cannot get a persistence of vision effect. There seems to be a bound on the frame rate or frame duration options, and so I can't get the animation to be fast enough. Adding more frames makes the animation smoother, but doesn't get me closer to POV. Maybe someone else knows more about generating animations/gifs/mp4s/etc.

I haven't tried making each frame a 2D "wedge" surface rather than a 1D cross section. But if we're going down that road, then we're giving up on actual persistence of vision anyway.

This particular example of a hyperbolic paraboloid may be part of the problem here. The frame rate for movies is only 24 frames per second, but that only works when changes between frames are small. When something is moving very fast, other visual effects interfere. Like the way wheels can appear to be spinning backward in a film. Your idea for animating the hyperbolic paraboloid uses rotation, and so we may run into similar problems.

So, if your true goal is persistence of vision, this particular example might not be the best case study. But if your goal is actually more like, "create a visualization that explains the structure of a surface in 3D by highlighting its slices", then we have more options. @azerbajdzan has provided a nice example of that.

Update based on comments

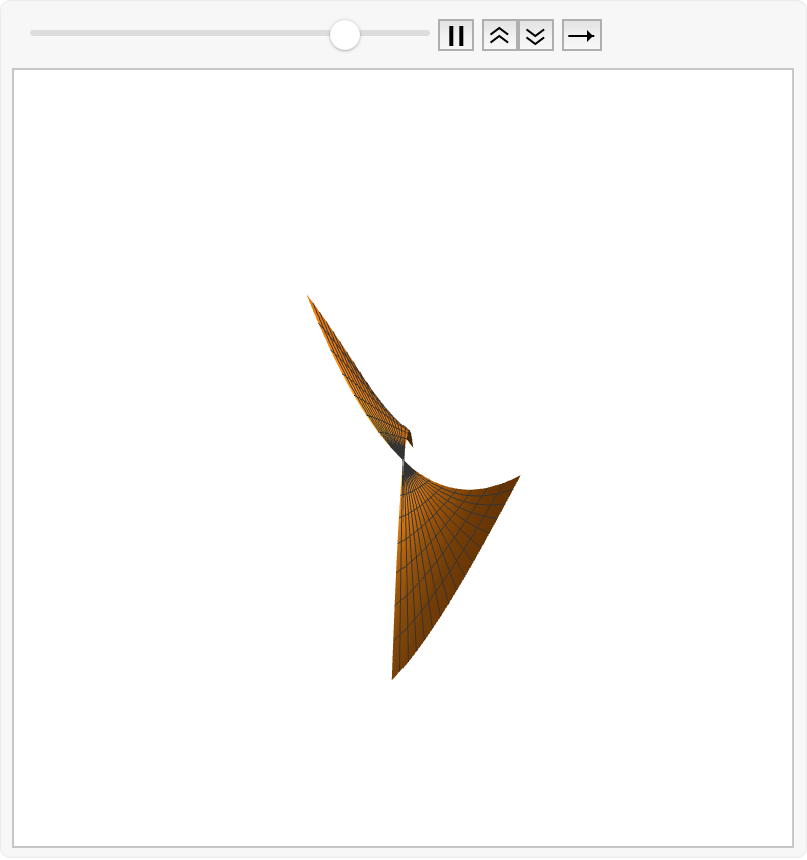
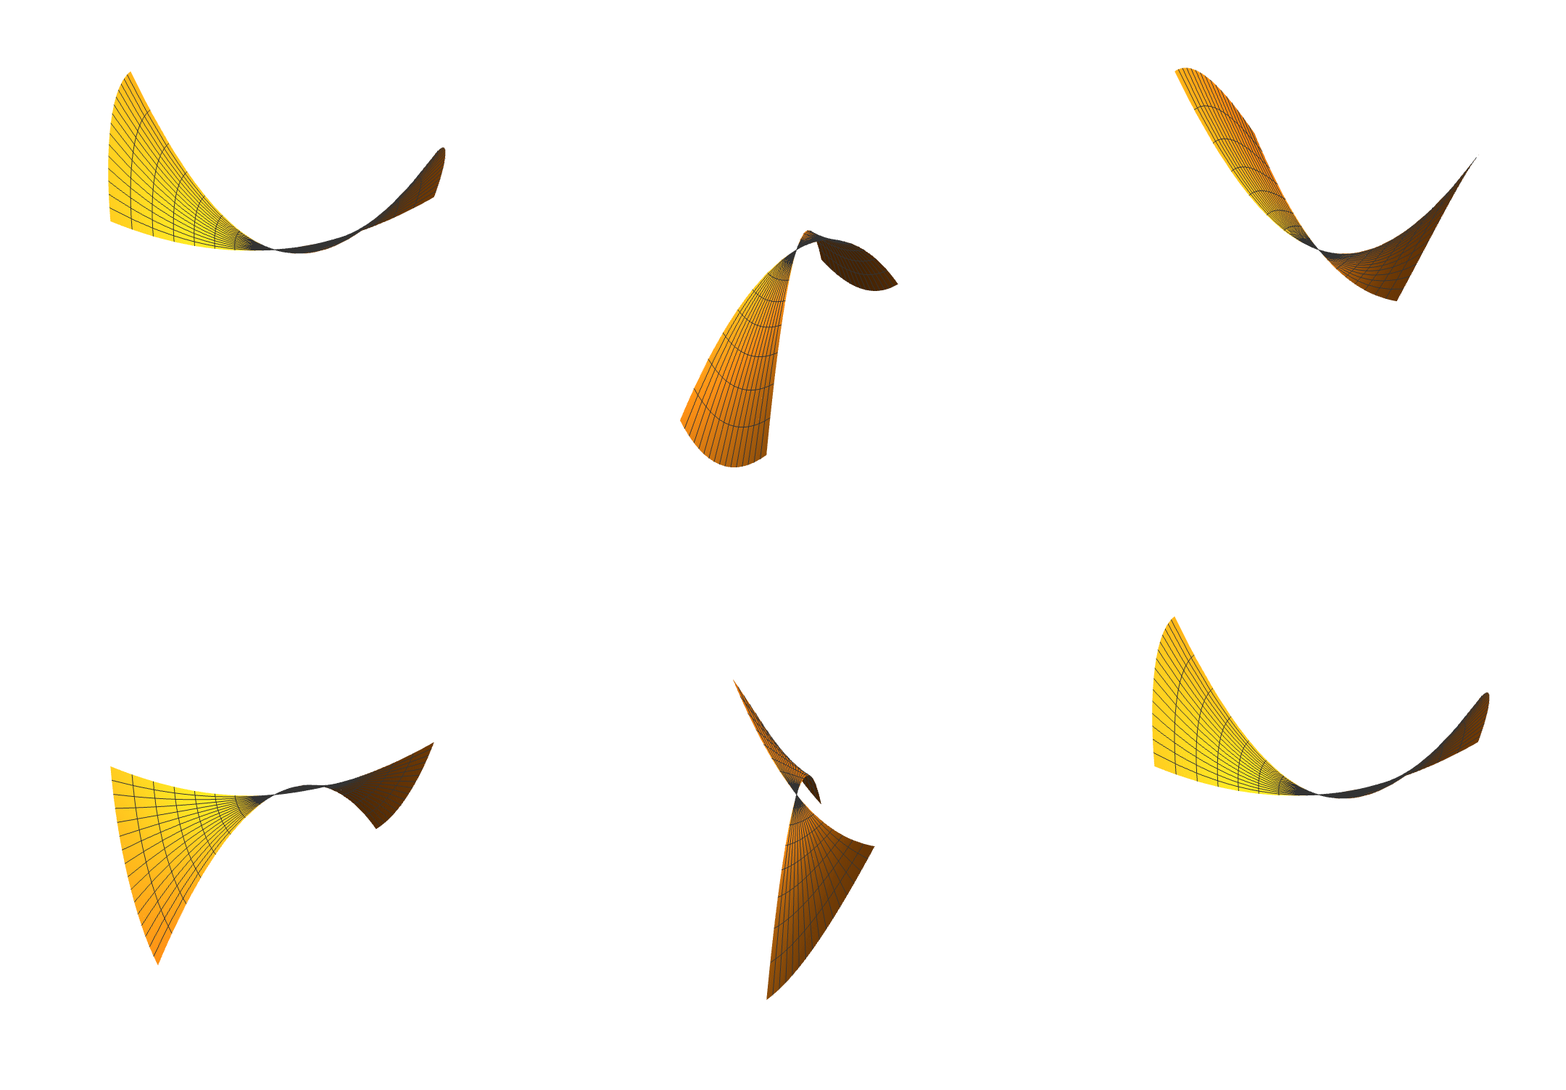
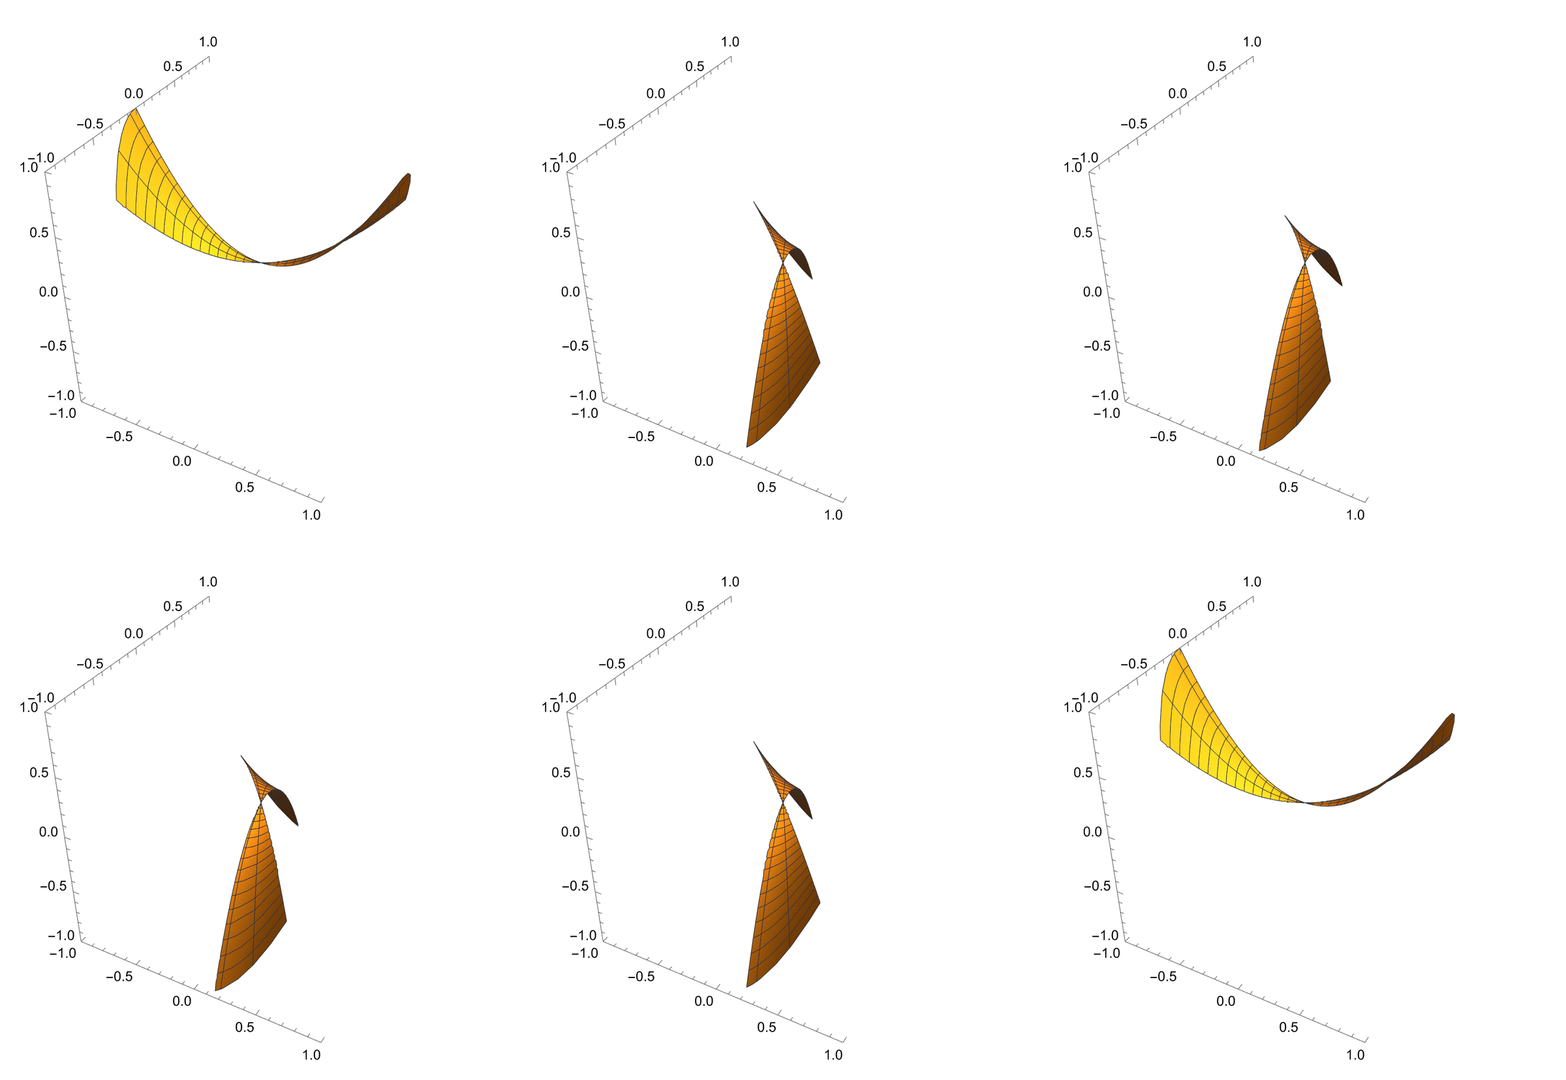
Here is how you can get some 2D to the slices (and I've also parameterized this a bit, so you can adjust the number of slices and the angular width of each slice).

slices =
  With[
    {count = 50},
    With[
      {sliceSize = 2 Pi/count},
      Table[
        ParametricPlot3D[{r Cos[t + s], r Sin[t + s], r^2 Cos[2 (t + s)]}, 
          {r, -1, 1}, 
          {s, 0, 5 sliceSize}, 
          PlotRange -> {-1, 1}, 
          Axes -> False, 
          Boxed -> False], 
        {t, 0, 2 Pi, sliceSize}]]];
ListAnimate[slices, 50]
(* This is just a single frame *)

enter image description here

Export as gif:

enter image description here

$\endgroup$
5
  • $\begingroup$ Great breakdown of the problem - the results so far are a great start. I believe I'll be able to increase the frame rate of an exported GIF or MP4, perhaps sufficient to get a persistence of vision effect. One thing is needed, though: The slices in your plot are drawn as lines, with no discernible thickness. Is it possible to make them have width, e.g. with each frame plotting a small interval of $\theta$ values? This will help the POV effect and allow illumination, which is critical. $\endgroup$ Commented Oct 10 at 17:31
  • $\begingroup$ To clarify: The POV effect requires each individual frame to plot the surface over a small interval of $\theta$. Ideally, these intervals should overlap, but, at a minimum, no gaps between them - this is what makes the POV possible. Likewise, each individual frame must show the effects of illumination (from a light source constant across all frames). $\endgroup$ Commented Oct 10 at 17:34
  • $\begingroup$ Gotcha. See update. Still haven't gotten anything that seems like a good POV effect to me, but maybe you can get something by tweaking the various options. $\endgroup$
    – lericr
    Commented Oct 10 at 20:28
  • $\begingroup$ Fantastic! This is exactly what I want, and I think that by modifying the frame rate of the exported GIF, I can get the POV effect. Wolfram Cloud won't allow me to export the GIF ("time exceeded") - are you able to post the actual GIF? $\endgroup$ Commented Oct 10 at 21:08
  • $\begingroup$ See update///// $\endgroup$
    – lericr
    Commented Oct 10 at 22:34
3
$\begingroup$
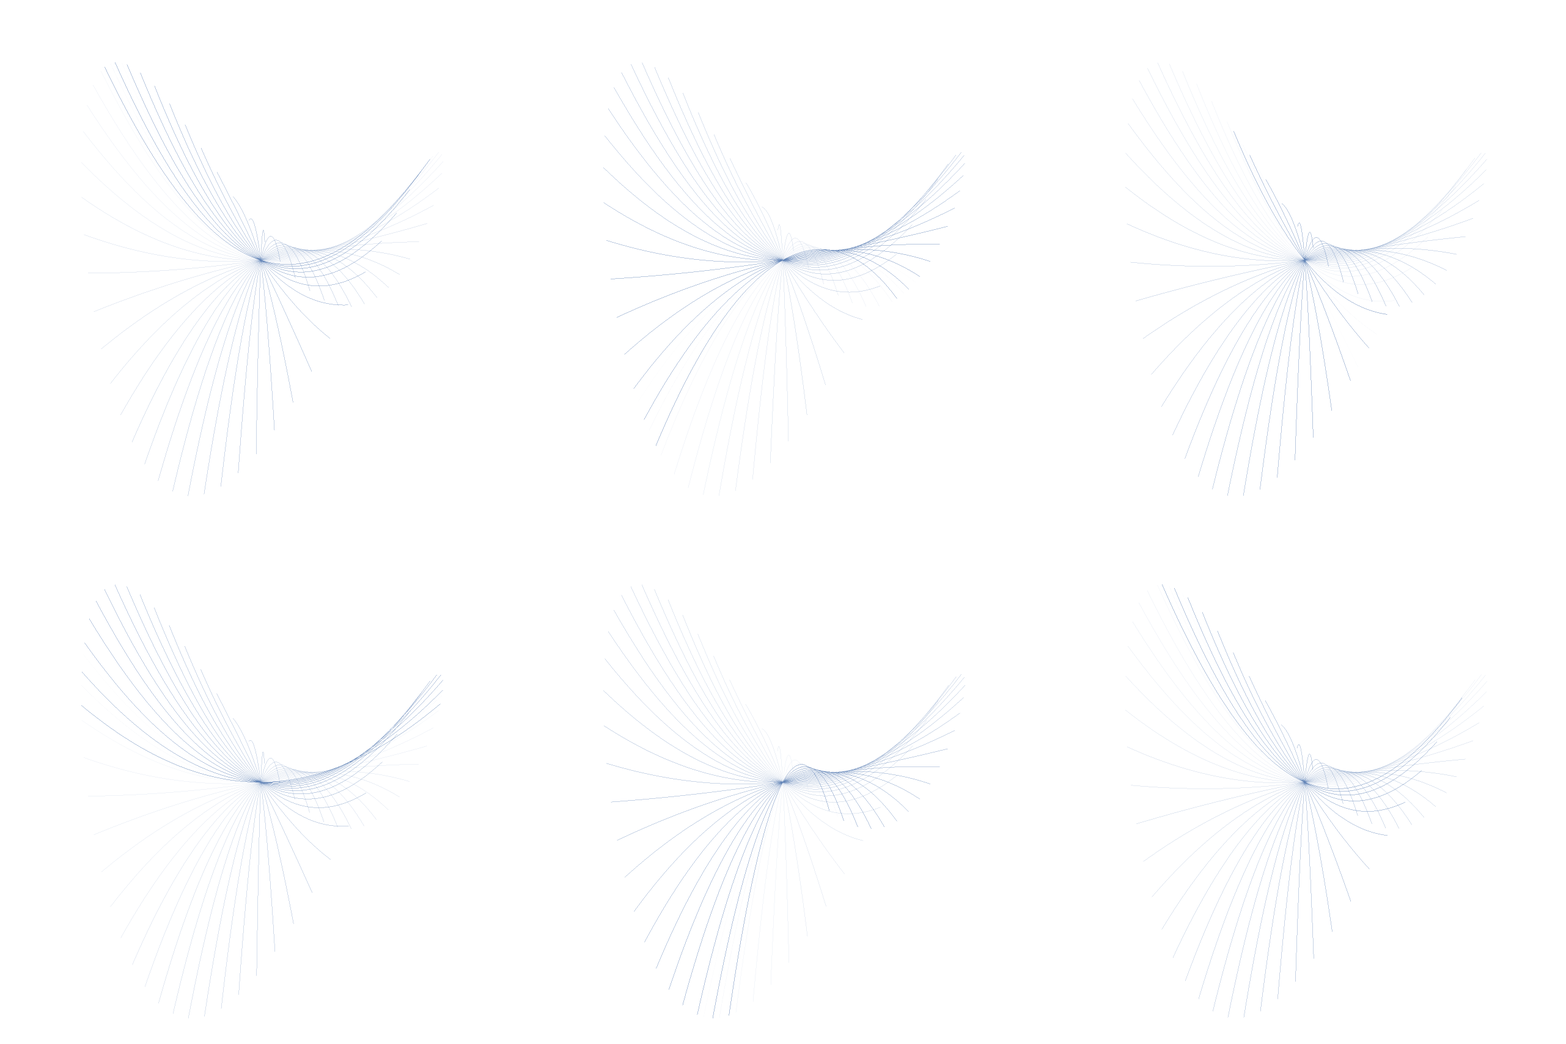
n = 35;
Table[ParametricPlot3D[
   Evaluate@
    Table[RotationMatrix[2 Pi fi - 0.1 q, {0, 0, 1}] . {x, 0, 
       x^2 Cos[2 (2 Pi fi - 0.1 q)]}, {q, 0, n}], {x, -1, 1}, 
   SphericalRegion -> Sphere[{0, 0, 0}, 1.5], PlotRange -> 1.5, 
   Boxed -> False, Axes -> False, ImageSize -> 640, 
   PlotStyle -> 
    Table[Directive[Opacity[q], Thin, ColorData[97, 1]], {q, 1, 
      0, -1/n}]], {fi, 0, 1 - 0.02, 0.02}];
Export["hp1.gif", %, "GIF", "DisplayDurations" -> 0.04]

enter image description here

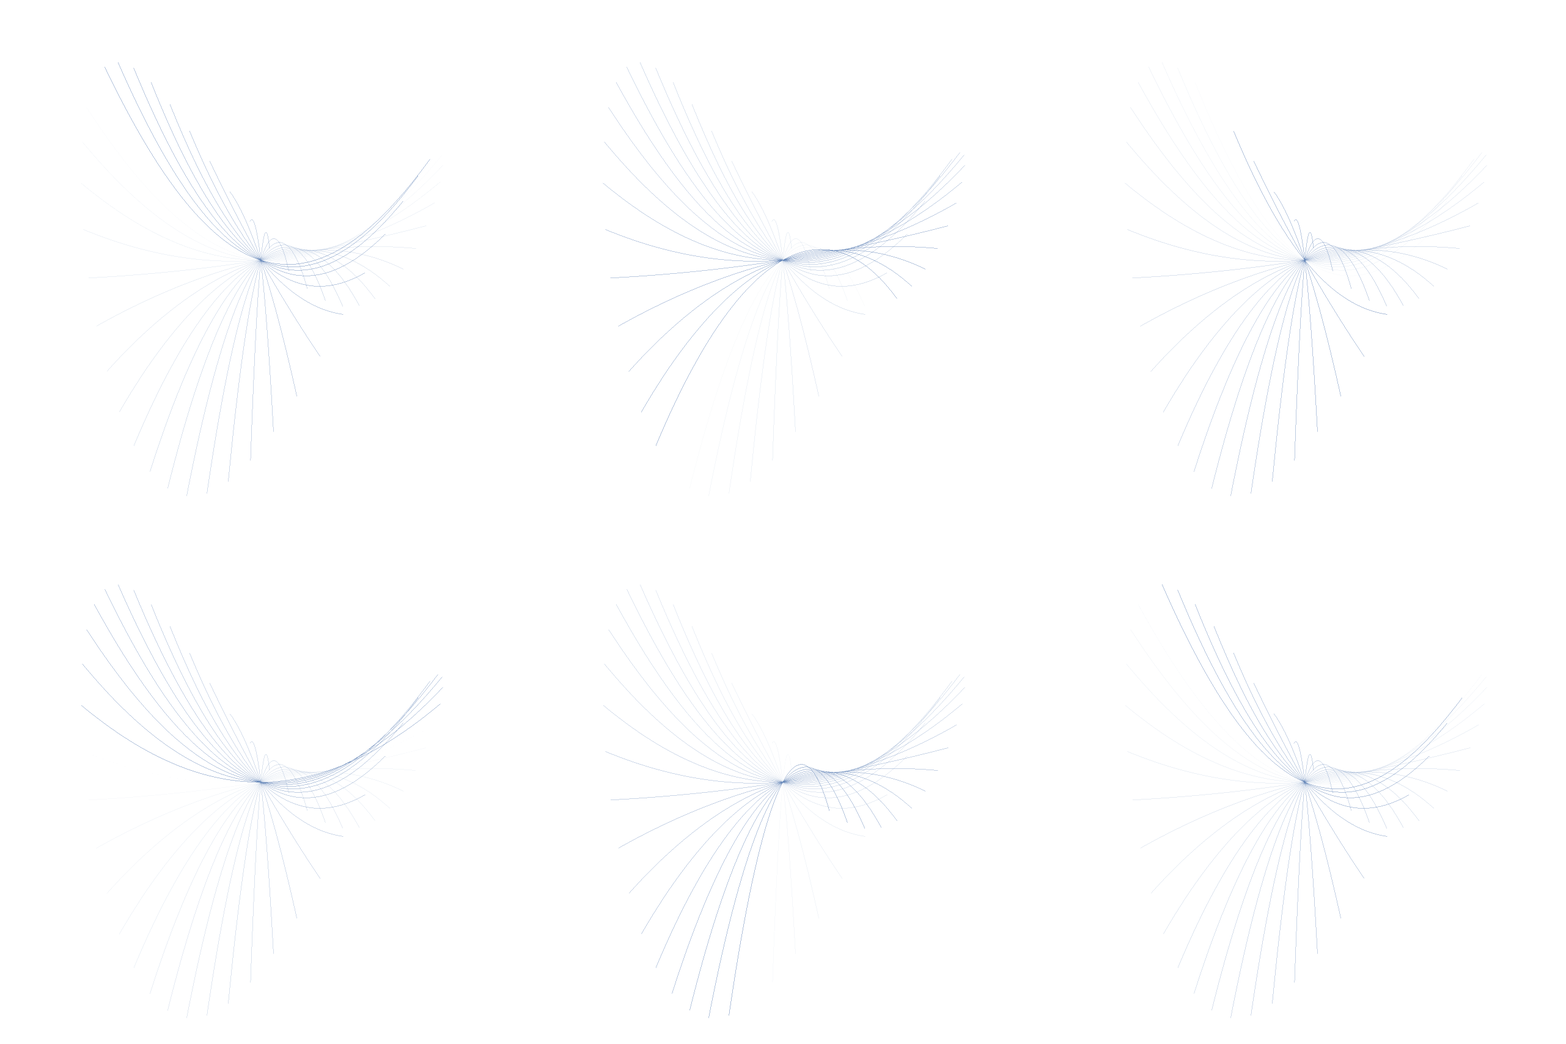
n = 25;
Table[ParametricPlot3D[
   Evaluate@
    Table[RotationMatrix[2 Pi (fi - 0.02 q), {0, 0, 1}] . {x, 0, 
       x^2 Cos[2 (2 Pi (fi - 0.02 q))]}, {q, 0, n}], {x, -1, 1}, 
   SphericalRegion -> Sphere[{0, 0, 0}, 1.5], PlotRange -> 1.5, 
   Boxed -> False, Axes -> False, ImageSize -> 640, 
   PlotStyle -> 
    Table[Directive[Opacity[q], Thin, ColorData[97, 1]], {q, 1, 
      0, -1/n}]], {fi, 0, 1 - 0.02, 0.02}];
Export["hp2.gif", %, "GIF", "DisplayDurations" -> 0.04]

enter image description here

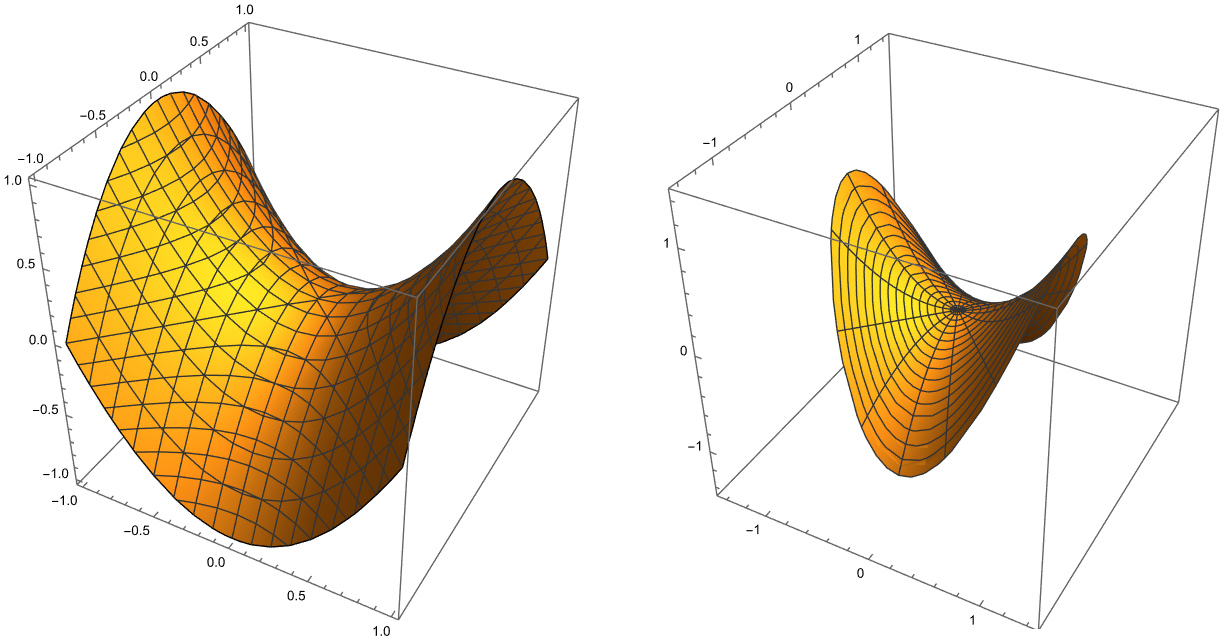
Personally I do not see any advantage using this animation over classical depicting of hyperbolic paraboloid.

ContourPlot3D[z == x^2 - y^2, {x, -1, 1}, {y, -1, 1}, {z, -1, 1}]
RevolutionPlot3D[
 r^2 Cos[2 \[Theta] + 0 Pi/2], {r, 0, 1}, {\[Theta], 0, 2 \[Pi]}, 
 PlotRange -> 3/2, BoxRatios -> {1, 1, 1}]

enter image description here

$\endgroup$
4
  • $\begingroup$ Thanks. The effect I'm looking for, however, isn't to show individual lines as they sweep around, but rather strips, such that, when they sweep around fast enough, you get the full surface, without any gaps. It has to be done in 3D, because the illumination is critical to perceiving the contours. I agree with you that doing this in 2D, with individual lines swept around, with white space in between them, and no room for lighting, is not advantageous. $\endgroup$ Commented Oct 10 at 17:19
  • $\begingroup$ It is 3D, not 2D. There will be no difference even if you do it with strips and no advantage over classic 3D surface like you see on the bottom image. $\endgroup$ Commented Oct 10 at 17:21
  • $\begingroup$ To clarify, the plots seem to be of individual lines (curves), with no discernible thickness. The POV effect requires each individual frame to plot the surface over a small interval of $\theta$. Ideally, these intervals should overlap, but, at a minimum, no gaps between them - this is what makes the POV possible. Likewise, each individual frame must show the effects of illumination (from a light source constant across all frames). $\endgroup$ Commented Oct 10 at 17:34
  • 1
    $\begingroup$ You haven't showed us any such an animation yet as I have already asked you in the comment below OP. $\endgroup$ Commented Oct 10 at 18:48
2
$\begingroup$

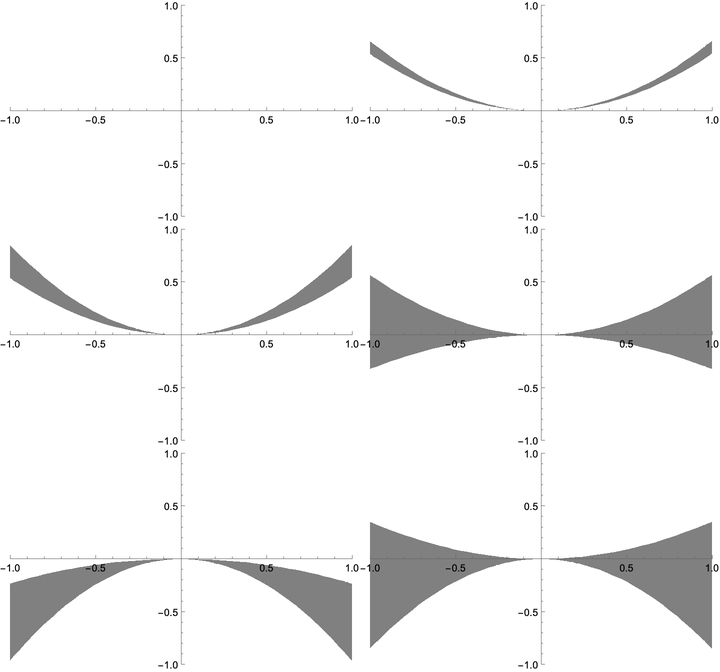
This could be a start. I just calculate $z$ at the endpoints of a fixed time window and plot the Filling between the endpoints at each t. Note I don't do any blurring based on the time density of the plot in the time window.

We define a version of z where we can specify a speed

z[r_, t_, speed_] := r^2 Cos[t*speed];

We then define a time window centered at t:

(*define window size of t*)
window = 5*10^-2;

Then we plot the values at the endpoints of t, and fill in between

zPlotWindow[r_, t_, speed_] := Module[{tab, tVals},

  (*grab window endpoint t values*)
  tVals = {(t - window)/2, (t + window)/2};
  
  (*calculate z[r,t,speed] at the given tValues and speed*)
  tab = Table[z[r, tStar, speed], {tStar, tVals}];
  
  (*plot the filling between the two endpoints*)
  Plot[tab, {r, -1, 1}, PlotRange -> {{-1, 1}, {-1, 1}},
   PlotStyle -> None, Filling -> {1 -> {{2}, Gray}}]]

And animate:

anim = Animate[zPlotWindow[r, t, 5 t^2 + 1], {t, 0, Pi, window/2}]

enter image description here

$\endgroup$
6
  • $\begingroup$ This is a good start. But for the effect to work, the plots needs to be on a 3D frame. I've updated the OP to clarify this - can you take a look? $\endgroup$ Commented Oct 10 at 5:25
  • $\begingroup$ Is Animate[RevolutionPlot3D[ r^2 Cos[2 \[Theta]], {r, 0, 1}, {\[Theta], 2 \[Pi]*s/n, 2 \[Pi]*(s + 4)/n}, ViewPoint -> {10, 10, 0}, PlotRange -> 1, Boxed -> False, Axes -> False, PlotStyle -> Black], {s, 0, 99}, AnimationRate -> 1000] closer to what you're looking for? I set a fixed ViewPoint for all the plots and got rid of the box and axes around the plot. I increased the animation rate to be very high $\endgroup$
    – ydd
    Commented Oct 10 at 6:19
  • $\begingroup$ Also if you add the option ViewAngle -> Pi/32 seems to help also. $\endgroup$
    – ydd
    Commented Oct 10 at 6:43
  • $\begingroup$ When I try the code in the comment, the animation box just says "\$Failed". $\endgroup$ Commented Oct 10 at 19:15
  • $\begingroup$ @SRobertJames works here (the animation is slower when I export so you can't really see the hyperbola in this exported example). Make sure you have n=100 still defined. $\endgroup$
    – ydd
    Commented Oct 10 at 20:11
1
$\begingroup$
  • Another version of the excellent answer by @lericr
Clear[interval];
interval = 1/2;
ani=Manipulate[
 ParametricPlot3D[{r Cos[t + s], r Sin[t + s], 
   r^2 Cos[2 (t + s)]}, {r, -1, 1}, {s, t, t + interval}, 
  PlotRange -> {-1, 1}, Axes -> False, Boxed -> False, 
  PerformanceGoal -> "Quality"], {t, 0, 2 π}]
Export["ani.gif", ani, "ControlAppearance" -> None];
SystemOpen["ani.gif"]
  • Or use the author's RevolutionPlot3D + RegionFunction
ani=Manipulate[
 RevolutionPlot3D[
  r^2 Cos[2 θ], {r, 0, 1}, {θ, 0, 2 π}, 
  BoxRatios -> 1, 
  RegionFunction -> 
   Function[{x, y, z, r, θ}, 
    RegionMember[
      ConicHullRegion[{{0, 0}}, {AngleVector[c], 
        AngleVector[c + 1/2]}], {x, y}] || 
     RegionMember[
      ConicHullRegion[{{0, 0}}, {AngleVector[π + c], 
        AngleVector[π + c + 1/2]}], {x, y}]], PlotRange -> 1, 
  PerformanceGoal -> "Quality"], {c, 0, 4 π}]

enter image description here

$\endgroup$

Your Answer

By clicking “Post Your Answer”, you agree to our terms of service and acknowledge you have read our privacy policy.

Not the answer you're looking for? Browse other questions tagged or ask your own question.