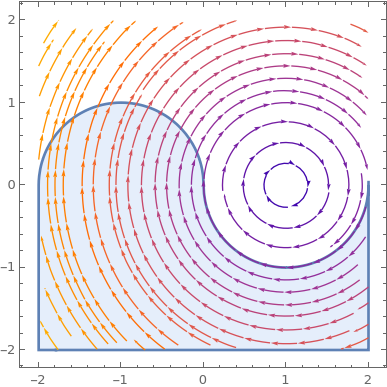
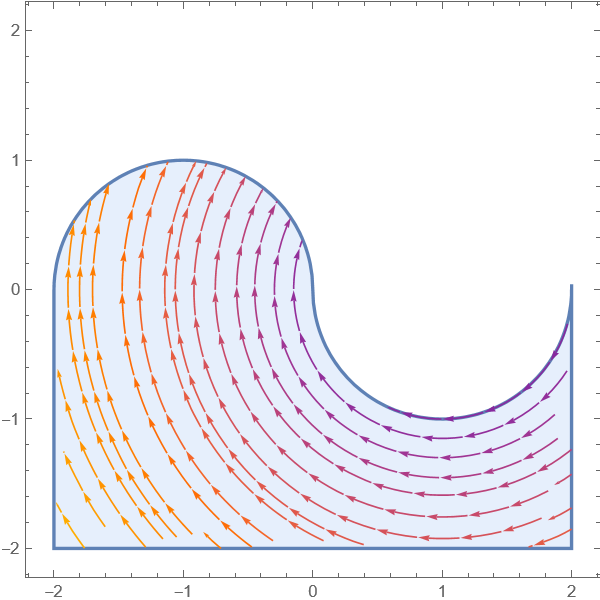
I am trying to bound the plotting region inside a StreamPlot using RegionFunctionwith a piecewise equation. Here's the code:
mm = 2;
(*Boundary on state space*)
f1 = Sqrt[-2 *x1 - x1^2];
f2 = -Sqrt[2 *x1 - x1^2];
x2f = Piecewise[{{f1, x1 <= 0}, {f2, x1 > 0}}];
x2ff = Function[x1, Evaluate@x2f];
plot1 = Plot[x2ff[x1], {x1, -mm, mm}];

(*Dynamical system*)
A = {{0, 1}, {-1, 0}};
b = {{0}, {1}};
eqdyn = Flatten[A . {{x1}, {x2}} + b];

StreamPlot[eqdyn, {x1, -mm, mm}, {x2, -mm, mm},
 RegionFunction -> Function[{x1, x2}, x2 < x2ff[x1]]]
The bounded region is correctly highlighted in the plot, but it's not respected. If i change f1 and f2 with something else it works as intended, like:
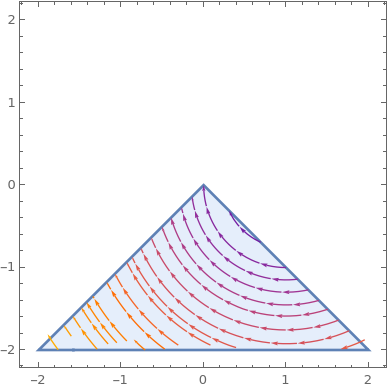
mm = 2;
(*Boundary on state space*)
f1 = x1;
f2 = -x1;

... rest of the code ...

