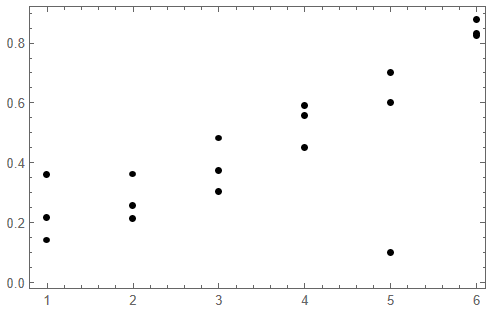
Imagine I have data points in triplicates, as follows $$ L=\begin{pmatrix} p_{11} & p_{12} & p_{13}\\ p_{21} & p_{22} & p_{23}\\ & \vdots &\\ p_{n1} & p_{n2} & p_{n3} \end{pmatrix} $$ What is the best way to filter this data, so that I remove outliers and end up with a vector of best-fit values $$ \tilde{L}=(\tilde{p}_1,\tilde{p}_2,\cdots,\tilde{p}_n) $$ Thoughts: For example, if I have the plot
list = Table[
   If[j == 5, {0.6, 0.7, 0.1},
    RandomReal[{0. + 0.1 j, 0.3 + 0.1 j}, 3]], {j, 6}];
ListPlot[Transpose@list, PlotStyle -> Black, Frame -> True,
 PlotRange -> All]
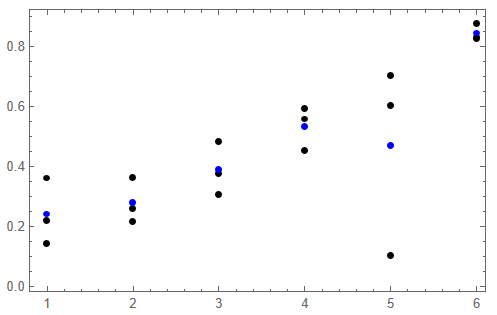
I could naturally take the mean of these values (in blue)
Show[
 ListPlot[Transpose@list, PlotStyle -> Black, Frame -> True,
  PlotRange -> All],
 ListPlot[Transpose@{Range[6], Mean /@ list}, PlotStyle -> Blue]
 ]
but clearly, at $n=5$ I have a potential outlier, which could be removed for a better fit. What would be the ideal technique to assign a weighted mean to each triplicate based on the overall dataset, possibly based on the average standard deviation between triplicates? I have heard about Cook's distance, but I am not too sure how to apply it here.
Any ideas?


