8
$\begingroup$

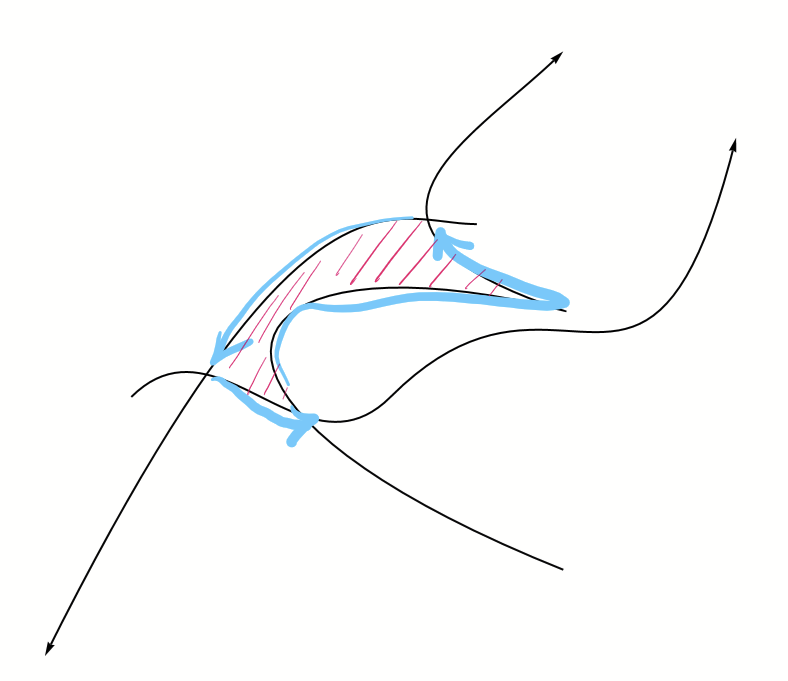
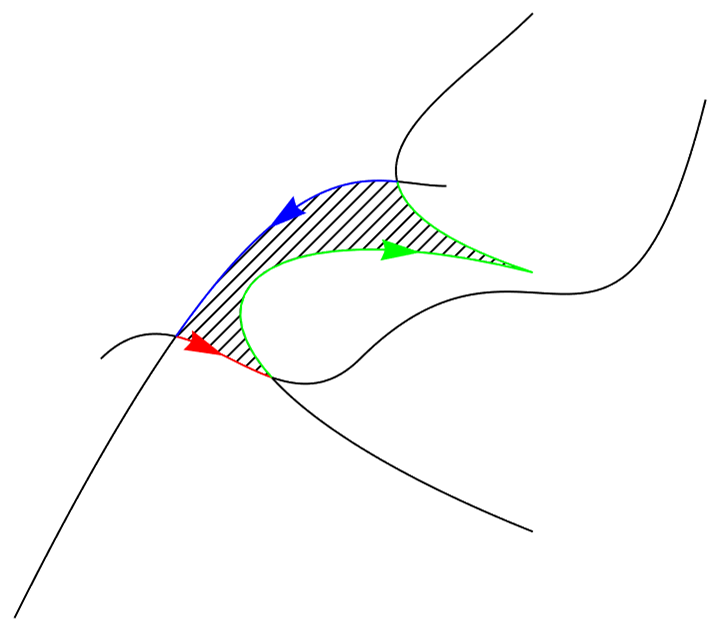
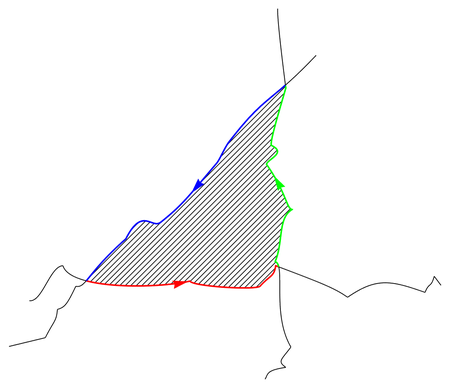
The desired result is

enter image description here

pts1 = {{0, 0}, {1, 1}, {2, -1}, {3, 0}, {5, 2}, {6, -1}, {7, 3}};
pts2 = {{5, -2}, {0, 0}, {1, 2}, {5, 1}, {2, 2}, {4, 3}, {5, 4}};
pts3 = {{4, 2}, {3, 2}, {2, 3}, {-1, -3}};
curves = {curve1, curve2, curve3} = 
   BezierCurve /@ {pts1, pts2, pts3};
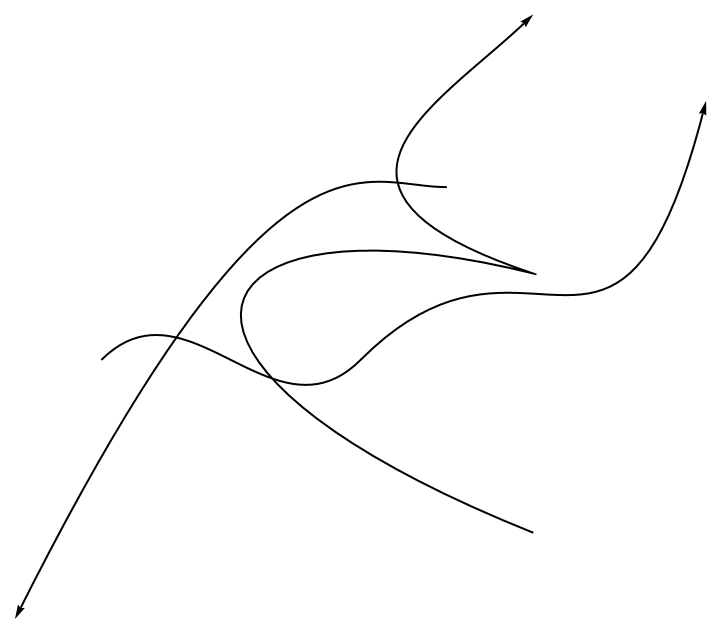
Graphics[{Arrowheads[.02], Arrow /@ curves}]

enter image description here

$\endgroup$
1
  • $\begingroup$ Did you try BezierFunction? It allows making the curve in the desired range. $\endgroup$
    – Rom38
    Commented Feb 15 at 9:22

3 Answers 3

3
$\begingroup$
Clear["Global`*"];
bezierFunction[pts_][t_] := Module[{nd, p, n, a, b},
  nd = 3;
  n = Length@p;
  p = Partition[pts, UpTo[nd + 1], nd];
  n = Length@p;
  a = ListConvolve[{-1, 1}, 
    Prepend[UnitStep[n  t - Range[n - 1]], 1], -1, 0];
  b = MapIndexed[
    BernsteinBasis[Length@#1 - 1, Range[0, Length@#1 - 1], 
       n  t + 1 - #2[[1]]] . #1 &, p];
  PiecewiseExpand[a . b]]
pts1 = {{0, 0}, {1, 1}, {2, -1}, {3, 0}, {5, 2}, {6, -1}, {7, 3}};
pts2 = {{5, -2}, {0, 0}, {1, 2}, {5, 1}, {2, 2}, {4, 3}, {5, 4}};
pts3 = {{4, 2}, {3, 2}, {2, 3}, {-1, -3}};
curves = {curve1, curve2, curve3} = 
   BezierCurve /@ {pts1, pts2, pts3};
g = Graphics[{Arrowheads[.02], Arrow /@ curves}];
fs1 = bezierFunction[pts1];
fs2 = bezierFunction[pts2];
fs3 = bezierFunction[pts3];
intersectionPosition[f_, g_] :=
  {s, t} /. 
   Last@NMinimize[{Norm[f@s - g@t]^2, 0 < s < 1, 0 < t < 1}, {s, t}, 
     Method -> "SimulatedAnnealing"];
{{t12, t21}, {t22, t31}, {t32, t11}} = 
  intersectionPosition @@@ {{fs1, fs2}, {fs2, fs3}, {fs3, fs1}};
{{t11, t12}, {t21, t22}, {t31, t32}}
plots = {ParametricPlot[fs1@t // Evaluate, {t, t11, t12}, 
   PlotStyle -> Red], 
  ParametricPlot[fs2@t // Evaluate, {t, t21, t22}, 
   PlotStyle -> Green], 
  ParametricPlot[fs3@t // Evaluate, {t, t31, t32}, 
   PlotStyle -> Blue]}; reg = 
 Cases[Show[plots, PlotRange -> All], Line[pts_] :> pts, -1] // 
   Catenate // Polygon;
Graphics[{{HatchFilling[], reg}, curves, Arrowheads[{{Large, .5}}], 
  plots[[;; , 1]] /. Line -> Arrow}]
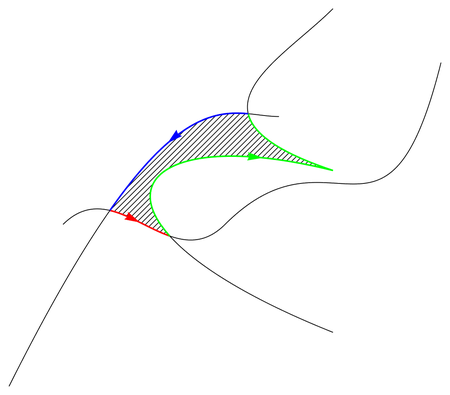
enter image description here

  • We can test another points.
Clear["Global`*"];
bezierFunction[pts_][t_] := Module[{nd, p, n, a, b}, nd = 3;
  n = Length@p;
  p = Partition[pts, UpTo[nd + 1], nd];
  n = Length@p;
  a = ListConvolve[{-1, 1}, 
    Prepend[UnitStep[n   t - Range[n - 1]], 1], -1, 0];
  b = MapIndexed[
    BernsteinBasis[Length@#1 - 1, Range[0, Length@#1 - 1], 
       n   t + 1 - #2[[1]]] . #1 &, p];
  a . b]
SeedRandom[123456];
pts1 = SortBy[RandomPoint[StadiumShape[{{-15, 0}, {70, 0}}, 4], 23], 
   First];
pts2 = SortBy[RandomPoint[StadiumShape[{{40, -20}, {40, 60}}, 3], 24],
    Last];
pts3 = ReverseSortBy[
   RandomPoint[StadiumShape[{{-20, -20}, {50, 50}}, 3], 23], First];
curves = {curve1, curve2, curve3} = 
   BezierCurve /@ {pts1, pts2, pts3};
fs1 = bezierFunction[pts1];
fs2 = bezierFunction[pts2];
fs3 = bezierFunction[pts3];
intersectionPosition[f_, g_] := {s, t} /. 
   Last@NMinimize[{Norm[f@s - g@t]^2, 0 < s < 1, 0 < t < 1}, {s, t}, 
     Method -> "SimulatedAnnealing"];
{{t12, t21}, {t22, t31}, {t32, t11}} = 
  intersectionPosition @@@ {{fs1, fs2}, {fs2, fs3}, {fs3, fs1}};
{{t11, t12}, {t21, t22}, {t31, t32}};
{plot1, plot2, 
   plot3} = {ParametricPlot[fs1@t // Evaluate, {t, t11, t12}, 
    PlotStyle -> Red], 
   ParametricPlot[fs2@t // Evaluate, {t, t21, t22}, 
    PlotStyle -> Green], 
   ParametricPlot[fs3@t // Evaluate, {t, t31, t32}, 
    PlotStyle -> Blue]};
{lines1, lines2, 
   lines3} = {Catenate@Cases[plot1, Line[pts_] :> pts, -1], 
   Catenate@Cases[plot2, Line[pts_] :> pts, -1], 
   Catenate@Cases[plot3, Line[pts_] :> pts, -1]};
Graphics[{{HatchFilling[], Polygon@Catenate@{lines1, lines2, lines3}},
   curves, AbsoluteThickness[2], 
  Arrowheads[{{Large, .5}}], {Red, Arrow@lines1}, {Green, 
   Arrow@lines2}, {Blue, Arrow@lines3}}]
enter image description here

$\endgroup$
6
$\begingroup$

First we need new definition of BezierFunction because actually (Mathematica v12.2) it's not possible to define Norm[BezierFunction[pts1][t]-pt] correctly

Find optimal BezierFunction (thanks @SjoerdSmid!)

bezCurve[{pt : {_, _}}] := pt &;
bezCurve[ctrlPts_?MatrixQ] := bezCurve[ctrlPts] = With[{
     b1 = bezCurve[Most[ctrlPts]],
     b2 = bezCurve[Rest[ctrlPts]]}(* 
    geometrische Konstruktion Bezierkurve*)
    , (1 - #)*b1[#] + #*b2[#] &];
(* hier wird erst der Kurvenparameter t eingeführt*)
bezCurve[ctrlPts_?MatrixQ, t_] := Simplify[bezCurve[ctrlPts][t]];

plot curves and find intersections

pts1 = {{0, 0}, {1, 1}, {2, -1}, {3, 0}, {5, 2}, {6, -1}, {7, 3}};
pts2 = {{5, -2}, {0, 0}, {1, 2}, {5, 1}, {2, 2}, {4, 3}, {5, 4}};
pts3 = {{4, 2}, {3, 2}, {2, 3}, {-1, -3}};
curves = {curve1, curve2, curve3} =Map[Function[u, Evaluate@bezCurve[#, u]] &, {pts1, pts2, pts3}];

bild = ParametricPlot[{curve1[u], curve2[u], curve3[u] }, {u, 0, 1},PlotStyle -> {Red, Green, Blue}];
sp = Graphics`Mesh`FindIntersections[bild[[All, 1]]  ]
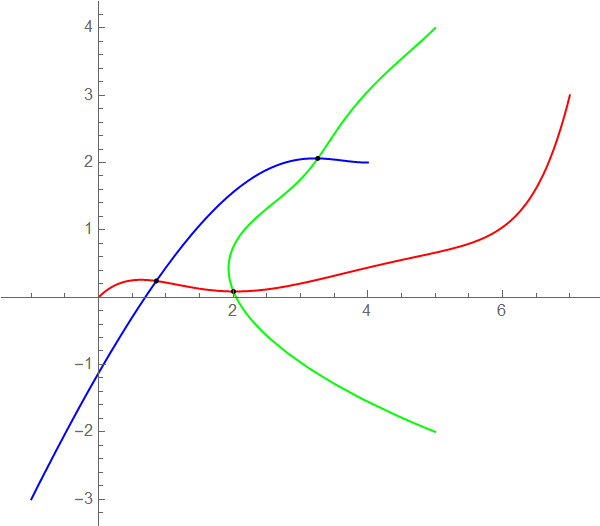
(* intersection points {{0.856312, 0.241003}, {2.00301, 0.0857585},{3.25519, 2.06216}}*)
Show[bild, Graphics[Point[sp]]]

enter image description here

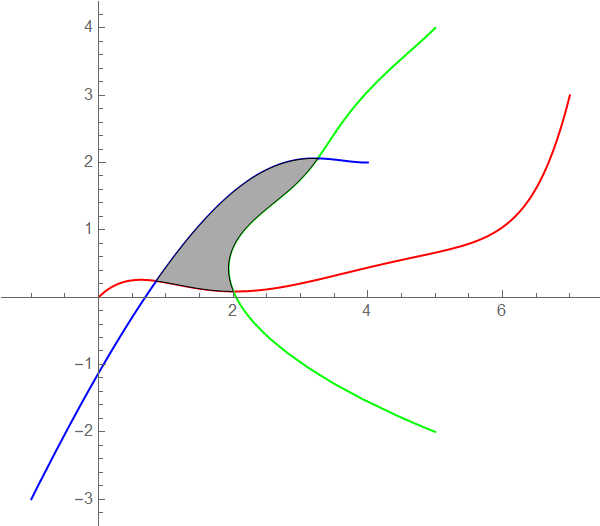
Now we find the parts of the beziercurves

{u11, u12} = {ArgMin[Norm[curve1[t] - sp[[1]]], t],ArgMin[Norm[curve1[t] - sp[[2]]], t]}
{u21, u22} = {ArgMin[Norm[curve2[t] - sp[[2]]], t],ArgMin[Norm[curve2[t] - sp[[3]]], t]}
{u31, u32} = {ArgMin[Norm[curve3[t] - sp[[1]]], t],ArgMin[Norm[curve3[t] - sp[[3]]], t]}

pic = Show[{ParametricPlot[curve1[u], {u, u11, u12}], 
ParametricPlot[curve2[u], {u, u21, u22}], 
ParametricPlot[curve3[u], {u, u31, u32}] } , PlotRange -> All] ;

Show[bild,Graphics[{FaceForm[Lighter[Gray]], EdgeForm[Black],
Polygon[Cases[pic, Line[p_] :> p, -1] // Flatten[#, 1] &]}]]

enter image description here

$\endgroup$
3
  • 3
    $\begingroup$ BezierCurve is different from BezierFunction , we can see that the curves and region is difference to the desired result. $\endgroup$ Commented Feb 15 at 22:16
  • $\begingroup$ @herbertfederer That is already clear . But BezierCurve is a Graphics primitive which doesn't allow access to plotted points . That's why I took BezierFunction in my answer! $\endgroup$ Commented Feb 16 at 8:21
  • $\begingroup$ @herbertfederer If you really need piecewise cubic spline like BezierCurve you should redefine 4-point Bezierspline {(1 - u)^3, 3 u (1 - u)^2, 3 u^2 (1 - u), u^3} .{p1,p2,p3,p4} $\endgroup$ Commented Feb 16 at 17:17
5
$\begingroup$

Edit

  • Does not depend on PlanarFaceList and we can distinct the boundary lines.
Clear["Global`*"];
pts1 = {{0, 0}, {1, 1}, {2, -1}, {3, 0}, {5, 2}, {6, -1}, {7, 3}};
pts2 = {{5, -2}, {0, 0}, {1, 2}, {5, 1}, {2, 2}, {4, 3}, {5, 4}};
pts3 = {{4, 2}, {3, 2}, {2, 3}, {-1, -3}};
curves = {curve1, curve2, curve3} = 
   BezierCurve /@ {pts1, pts2, pts3};
g = Graphics[{Arrowheads[.02], Arrow /@ curves}];

lines = MeshPrimitives[DiscretizeGraphics@#, 1] & /@ curves;
data = Region`Mesh`SplitIntersectingSegments[lines];
pts = data[[1]];
splits = data[[2]];
intersections = Cases[splits, l_ /; Length@l == 3, -1];
boundaryLinesIndexs = 
  Join[{#[[1, 2]]}, Range[#[[1, -1]], #[[2, 1]]], {#[[2, 2]]}] & /@ 
   Partition[intersections, 2];
reg = BoundaryMeshRegion[pts, Line /@ boundaryLinesIndexs];
Graphics[{{HatchFilling[], reg}, curves, Arrowheads[{{Large, .5}}], 
  Thread[{{Red, Green, Blue}, 
    Arrow@pts[[#]] & /@ boundaryLinesIndexs}]}]

enter image description here

Clear["Global`*"];
pts1 = {{0, 0}, {1, 1}, {2, -1}, {3, 0}, {5, 2}, {6, -1}, {7, 3}};
pts2 = {{5, -2}, {0, 0}, {1, 2}, {5, 1}, {2, 2}, {4, 3}, {5, 4}};
pts3 = {{4, 2}, {3, 2}, {2, 3}, {-1, -3}};
curves = {curve1, curve2, curve3} = 
   BezierCurve /@ {pts1, pts2, pts3};
g = Graphics[{Arrowheads[.02], Arrow /@ curves}];
lines = MeshPrimitives[DiscretizeGraphics@curves, 1];
data = Region`Mesh`SplitIntersectingSegments[lines];
pts = data[[1]];
splits = data[[2]];
segments = Flatten[Partition[#, 2, 1] & /@ splits, 1];
graph = Graph[Range@Length@pts, UndirectedEdge @@@ segments, 
   VertexCoordinates -> pts];
faces = PlanarFaceList[graph];
polys = Polygon[pts[[#]]] & /@ faces;
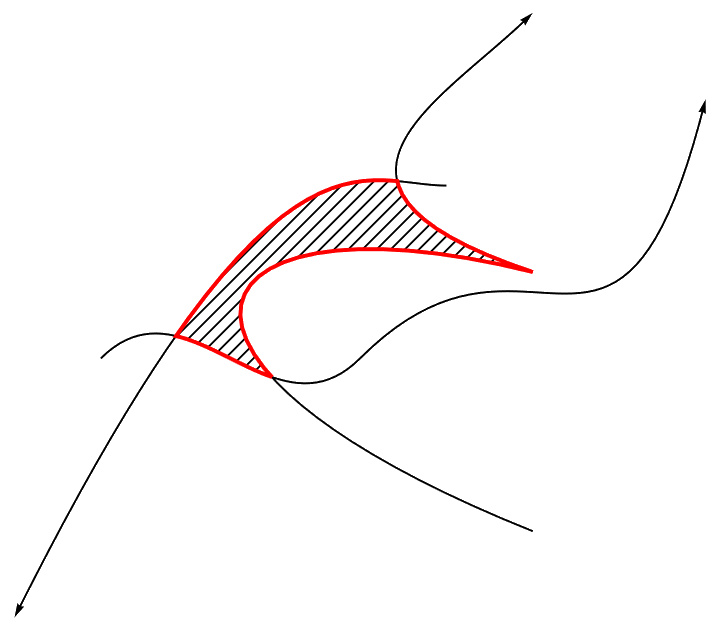
Show[g, Graphics[{HatchFilling[], EdgeForm[{Thick, Red}], 
   polys[[2]]}]]

enter image description here

Clear["Global`*"];
pts1 = {{0, 0}, {1, 1}, {2, -1}, {3, 0}, {5, 2}, {6, -1}, {7, 3}};
pts2 = {{5, -2}, {0, 0}, {1, 2}, {5, 1}, {2, 2}, {4, 3}, {5, 4}};
pts3 = {{4, 2}, {3, 2}, {2, 3}, {-1, -3}};
curves = {curve1, curve2, curve3} = 
   BezierCurve /@ {pts1, pts2, pts3};
reg = RegionUnion[DiscretizeGraphics /@ curves];
g = Graph[MeshPrimitives[reg, 1] /. Line -> Apply@UndirectedEdge, 
   VertexCoordinates -> MeshCoordinates[reg]];
faces = PlanarFaceList[g];
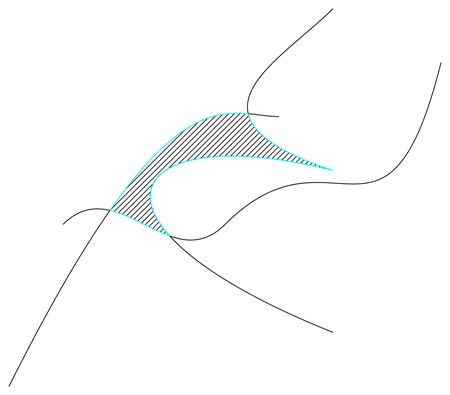
Graphics[{curves, HatchFilling[], EdgeForm[Cyan], 
  Polygon@faces[[2]]}]

enter image description here

$\endgroup$
5
  • $\begingroup$ What a useful function RegionMeshSplitIntersectingSegments[lines], didn't know it. How did you find it? $\endgroup$ Commented Feb 17 at 14:59
  • $\begingroup$ @UlrichNeumann It is first discover by halmir mathematica.stackexchange.com/a/267223/72111 $\endgroup$
    – cvgmt
    Commented Feb 17 at 15:04
  • $\begingroup$ Thanks for your reply! data contains ordered linesegments and information about the intesection points. I wonder if the solution couldn't be obtained easily directly from this without the help of Graph and PlanarFaceList. $\endgroup$ Commented Feb 18 at 13:29
  • $\begingroup$ Your edit answers my last question $\endgroup$ Commented Feb 18 at 14:20
  • $\begingroup$ @UlrichNeumann Only for simple n-cycle can we avoid using Planar Graph. $\endgroup$
    – cvgmt
    Commented Feb 18 at 14:37

Your Answer

By clicking “Post Your Answer”, you agree to our terms of service and acknowledge you have read our privacy policy.

Not the answer you're looking for? Browse other questions tagged or ask your own question.