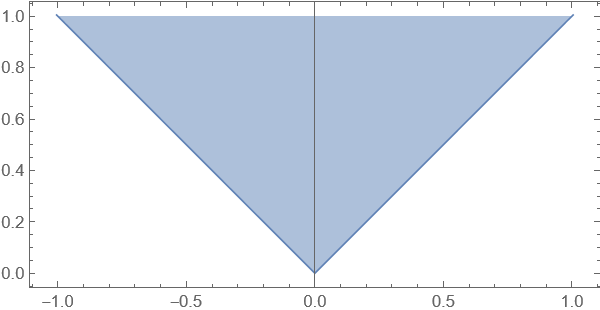
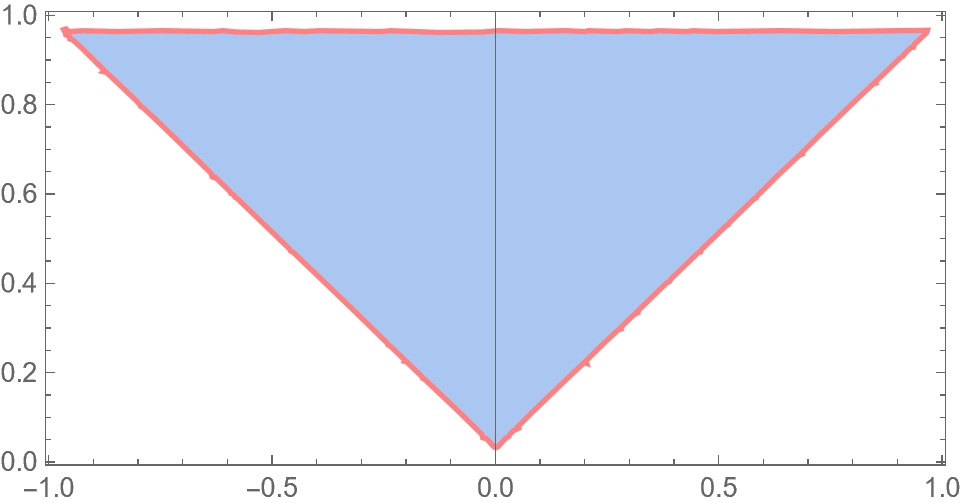
How can I use Mathematica to plot the region $$\left\{\big(\cos(x+y),\cos(x-y)\big)\left\lvert(x,y)\in\left(0,\frac\pi2\right)^2\right.\right\}~?$$
I thought of using RegionPlot and "$\arccos$"s, but this wouldn't work if I were to plot the region
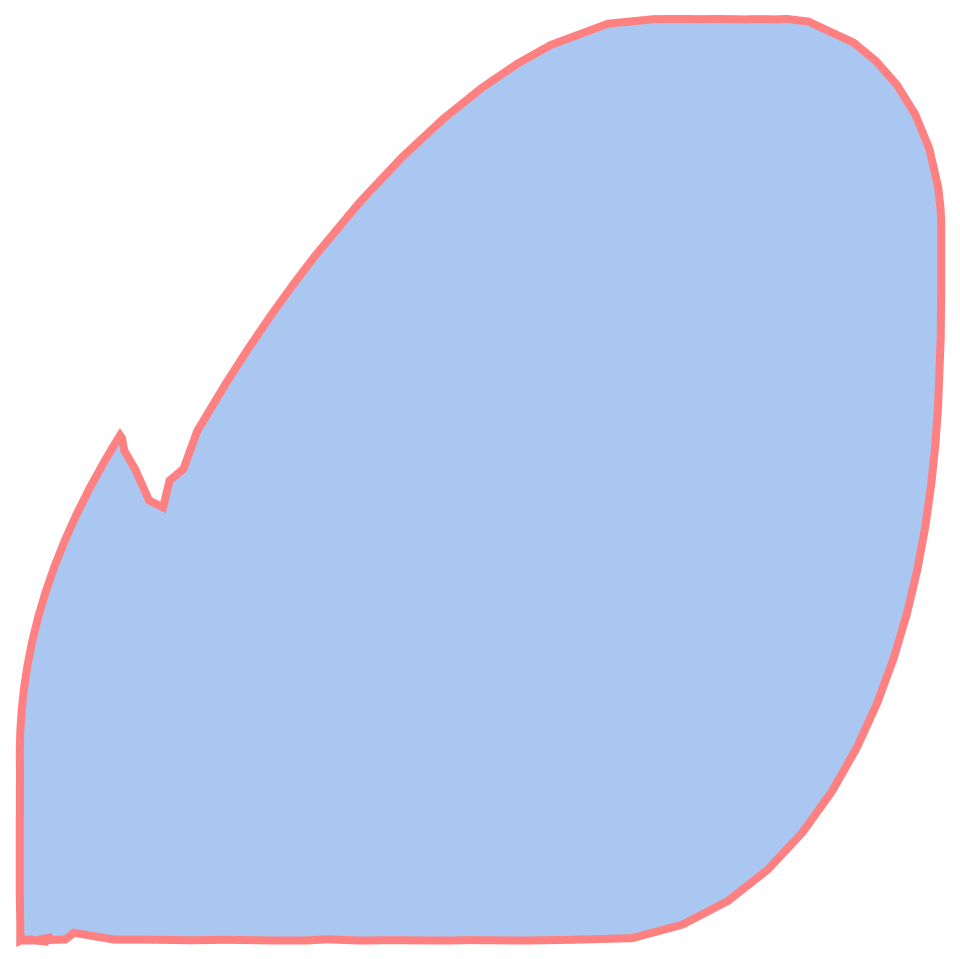
$$\left\{\big(\cos\left(x^2+\sin y\right),\cos\left(\mathrm e^x-y\right)\big)\left\lvert(x,y)\in\left(0,\frac\pi2\right)^2\right.\right\}.$$
Another way might be to use two great loop with small increment of $x$, $y$, but that's not efficient.


