1
$\begingroup$
FunctionRange[Cos[Abs[x]] - 2 Abs[Sin[x]], x, y] // FullSimplify

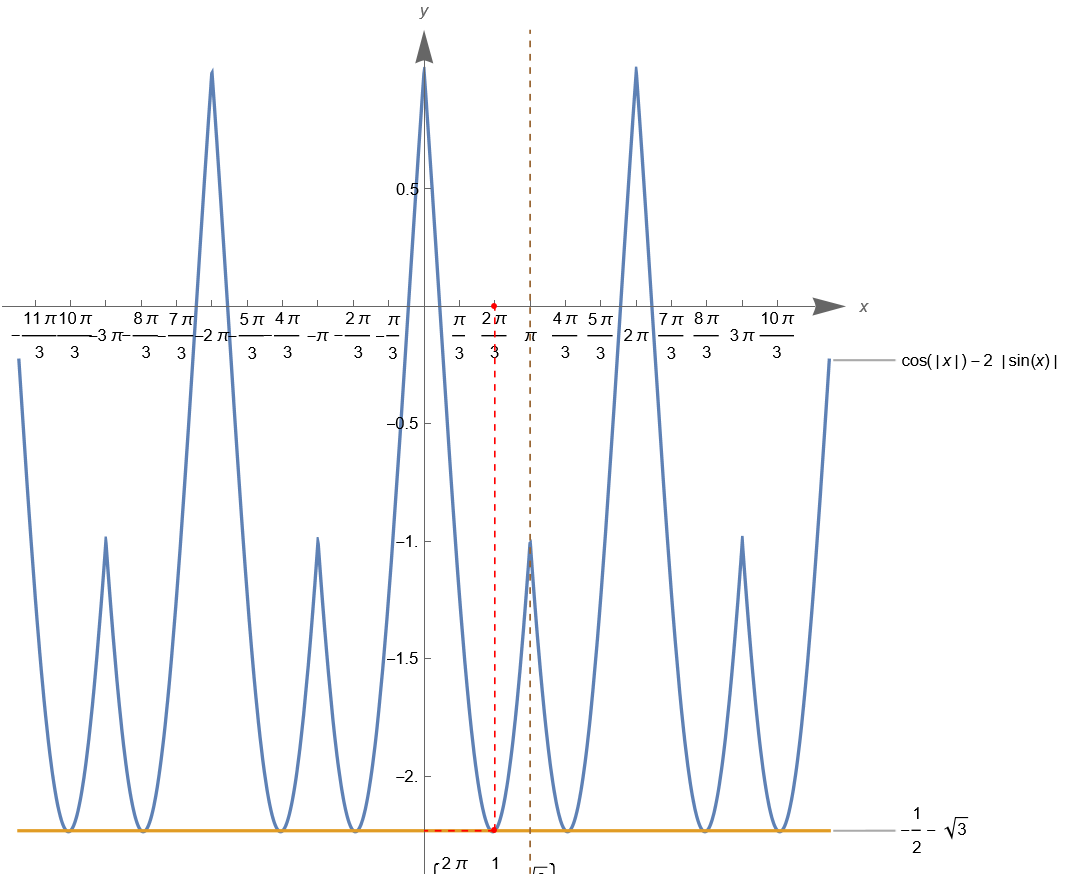
Why is there such a prompt when using the above code to calculate the value range of a function?

FunctionRange::eopt: Unable to find the exact range. Returning bounds on the range computed using optimization methods.

and get the result:

-Sqrt[5] <= y <= 1

enter image description here

The result obtained by the software is correct based on the calculation process in the above image, and the function is symmetric about the line x=pi,And the period of the function is 2pi. Why would prompt content still appear?

enter image description here

To eldo:

FunctionRange[Sin[RealAbs[x]] + RealAbs[Sin[x]], x, y]

When using RealAbs to calculate the value range of the above functions, the prompt still exists. What is the reason?

enter image description here

$\endgroup$
1
  • $\begingroup$ In the 2nd case RealAbs returns 0. <= y <= 2. and Abs returns 1.59995*10^-11 <= y <= 2.. I don't know why this small difference exists. I also don't know why RealAbs handles the first case silently, but issues a warning in the 2nd case. $\endgroup$
    – eldo
    Commented Jan 31 at 12:50

1 Answer 1

2
$\begingroup$

RealAbs gives the result without warning (see documentation details)

FunctionRange[Cos[RealAbs[x]] - 2 RealAbs[Sin[x]], x, y] // FullSimplify

enter image description here

$\endgroup$
2
  • $\begingroup$ Why does using Abs have no effect on function graphs? $\endgroup$
    – csn899
    Commented Jan 31 at 12:08
  • $\begingroup$ @csn899 Plotting is an inherently numerical process. Once you plug in real numbers, there is no discernible difference between Abs and RealAbs. $\endgroup$
    – MarcoB
    Commented Jan 31 at 12:16

Your Answer

By clicking “Post Your Answer”, you agree to our terms of service and acknowledge you have read our privacy policy.

Not the answer you're looking for? Browse other questions tagged or ask your own question.