2
$\begingroup$

The definition domain of function f [x] is R, satisfying that f[x+1]=2f[x],

and when x belongs to (0, 1], f [x]=x(x-1).

If for any x belongs to (-[Infinity], m], there is f [x]>=-8/9, find the value range of m

  1. How to draw an image of the function f [x] within a certain interval

2.How to calculate the value of m?

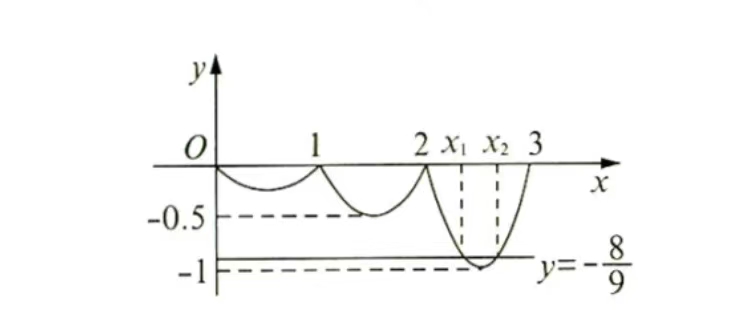
The image roughly looks like this:

enter image description here

Clear["Global`*"]
f[x_] := 2^Floor[x]  Mod[x, 1]  (Mod[x, 1] - 1)
Plot[f[x], {x, 0, 4}]
Grid[Table[{n < x < n + 1, 
   Expand@FullSimplify[f[x], Assumptions -> n < x < n + 1]}, {n, -5, 
   5}], Frame -> All]
$\endgroup$

3 Answers 3

8
$\begingroup$

Edit

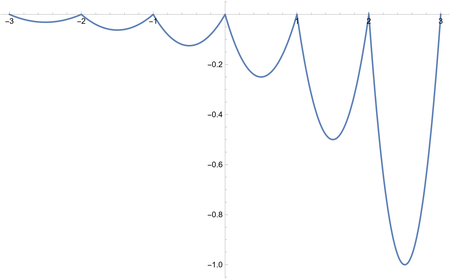
  • For x<0,we rewrite f[x+1]=2f[x] to `f[x]=f[x+1]/2;
Clear["Global`*"];
f[x_] := x (x - 1); /; 0 < x <= 1;
f[x_] := 2 f[x - 1] /; x >= 1;
f[x_] := f[x + 1]/2 /; x < 0
Plot[f[x], {x, -3, 3}]

enter image description here

Original

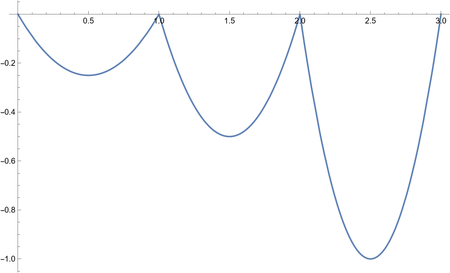
f[x_] := x (x - 1); /; 0 < x <= 1;
f[x_] := 2 f[x - 1] /; x >=1;
Plot[f[x], {x, 0, 3}]

enter image description here

$\endgroup$
3
  • $\begingroup$ If for any x belongs to (-[Infinity], m], there is f [x]>=-8/9, find the value range of m $\endgroup$
    – csn899
    Commented Nov 11, 2023 at 2:12
  • $\begingroup$ How can I draw an image when x<0? $\endgroup$
    – csn899
    Commented Nov 12, 2023 at 12:36
  • $\begingroup$ Why can't I change x<0 to x<=0 to draw a function graph? Clear["Global`*"] f[x_] := x (x - 1); /; 0 < x <= 1; f[x_] := 2 f[x - 1] /; x >= 1; f[x_] := 1/2 f[x + 1] /; x <= 0; Plot[f[x], {x, -3, 3}] The prompt message is:TerminatedEvaluation["RecursionLimit"] $\endgroup$
    – csn899
    Commented Nov 13, 2023 at 3:30
7
$\begingroup$
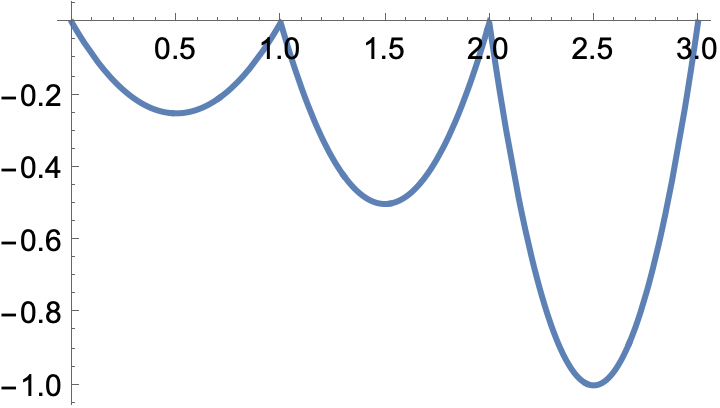
Plot[With[{qr = QuotientRemainder[x, 1]}, 
  2^First[qr] Last[qr] (Last[qr] - 1)], {x, 0, 3}]
$\endgroup$
6
  • 1
    $\begingroup$ Also, Plot[2^IntegerPart[x] FractionalPart[x] (FractionalPart[x] - 1), {x, 0, 3}] $\endgroup$
    – Goofy
    Commented Nov 11, 2023 at 2:00
  • $\begingroup$ If for any x belongs to (-[Infinity], m], there is f [x]>=-8/9, find the value range of m $\endgroup$
    – csn899
    Commented Nov 11, 2023 at 2:12
  • $\begingroup$ I don't think you can say $\forall x \in (-\infty,m] .\exists x . \ \text{such that}\ f(x) \ge -8/9$. That you wrote "there is f[x] >= -8/9" does not change the fact that $x$ is already quantified by "for any x." Did you mean "Find m such that for all x in (-infinity, m], f(x) >= -8/9"? $\endgroup$
    – Goofy
    Commented Nov 11, 2023 at 2:25
  • $\begingroup$ It means that for all x within this interval, its corresponding function values are greater than or equal to -8/9 $\endgroup$
    – csn899
    Commented Nov 11, 2023 at 2:29
  • 1
    $\begingroup$ Perhaps First@Solve[2^IntegerPart[x] FractionalPart[x] (FractionalPart[x] - 1) == -8/9 && 0 <= x <= 3, x, Reals] $\endgroup$
    – Goofy
    Commented Nov 11, 2023 at 2:42
6
$\begingroup$
$Version

(* "13.3.1 for Mac OS X ARM (64-bit) (July 24, 2023)" *)

Clear["Global`*"]

f[x_?NumericQ] := x (x - 1); /; 0 < x <= 1;
f[x_?NumericQ] := 2 f[x - 1] /; x >= 1;

xVal = Table[
  x /. FindRoot[f[x] == -8/9, {x, #}][[1]] & /@
   {n + 0.25, n + 0.75},
  {n, {2, 3}}]

(* {{2.33333, 2.66667}, {3.12732, 3.87268}} *)

f2[x_] = 
 ConditionalExpression[f[x], Or @@ (#[[1]] <= x <= #[[2]] & /@ xVal)]

(* ConditionalExpression[f[x], 
 2.33333 <= x <= 2.66667 || 3.12732 <= x <= 3.87268] *)

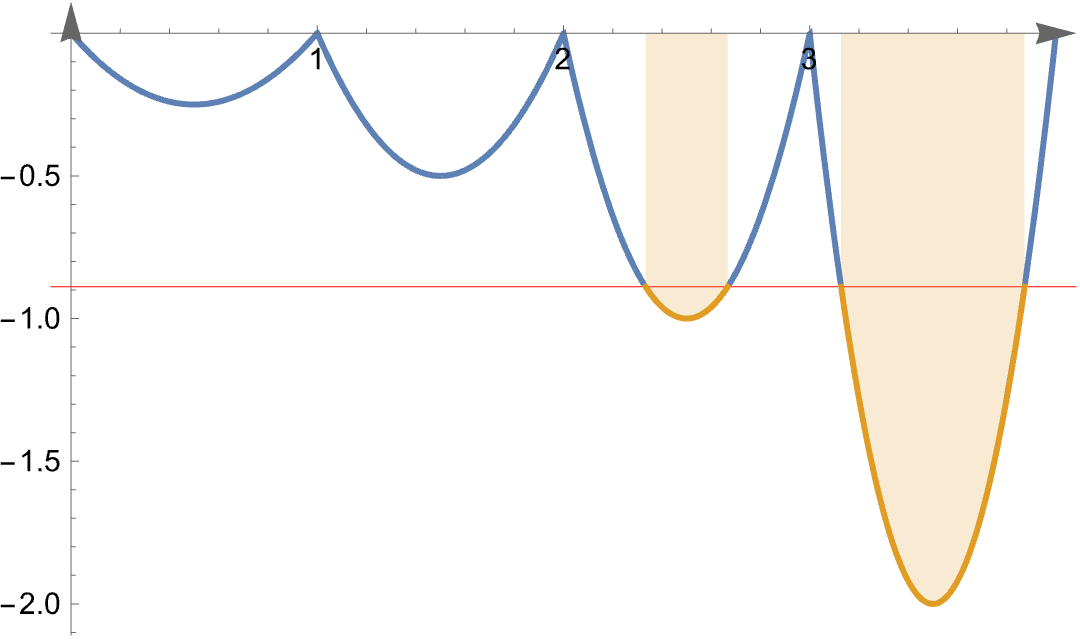
Plot[{f[x], f2[x]}, {x, 0, 4},
 Filling -> 2 -> Axis,
 AxesStyle -> Arrowheads[0.04],
 GridLines -> {None, {-8/9}},
 GridLinesStyle -> Red]

enter image description here

$\endgroup$
1
  • $\begingroup$ How can I draw an image when x<0? $\endgroup$
    – csn899
    Commented Nov 12, 2023 at 12:36

Your Answer

By clicking “Post Your Answer”, you agree to our terms of service and acknowledge you have read our privacy policy.

Not the answer you're looking for? Browse other questions tagged or ask your own question.