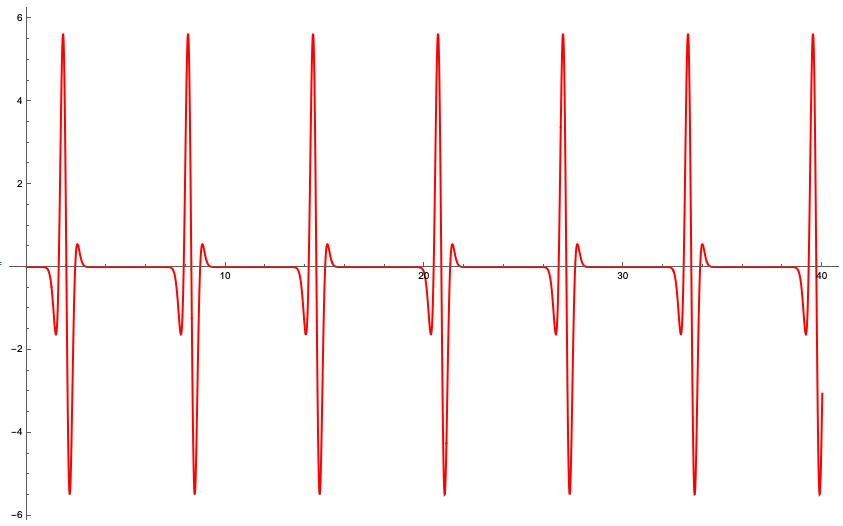
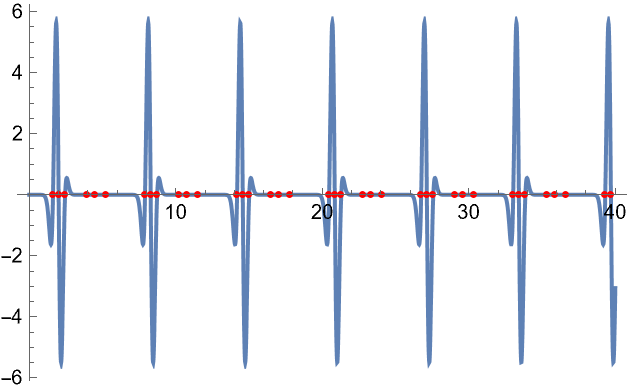
I have a function as follows,
$ \pi^{\prime}_{xx} = \exp(-2 k_x^2 \sin^2(\frac{t}{2})) k_x^2 \theta(t) \times \bigg[ -\frac{\sin(2t)}{2} - \cos(t) \sin(t) (1 - k_x^2 \sin^2(\frac{t}{2})) + 2 \cos(t) \sin^2(\frac{t}{2}) \sin^2(t) + 2 \sin^2(t)- 4 k_x^2 \sin^2(t) \sin^2(\frac{t}{2}) - 2 \sin(2t) \cos(t) \sin^2(t) - \sin(2t) \sin^2(t) + 2 k_x^2 \sin(2t) \sin^2(t) \sin^2(\frac{t}{2}) \bigg]$
I plotted it like
pixx = k^2 Exp[-2 k^2 Sin[(t)/2]^2 ](-Sin[2t] - Sin[t](1-k^2 Sin[t]^2));
piyy = k^2 Exp[ -2 k^2 Sin[(t)/2 ]^2 ](-4Sin[t]Sin[(t)/2]^2 - Sin[t](1-4k^2 Sin[(t)/2]^4)) ;
pixy = k^2 Exp[-2k^2 Sin[(t)/2 ]^2 ](2Cos[t]Sin[(t)/2]^2 + Sin[t]^2 - 2 k^2 Sin[(t)/2]^2 Sin[t]^2);

xxrot = Cos[t + 2.0 - \[Pi] / 2]^2 pixx +
   Sin[t + 2.0 - \[Pi] / 2]^2 piyy -
   Sin[2 (t + 2.0 - \[Pi] / 2)] pixy;

i2k[i_] = 1/2 (i - 1) ;

xxrotplt =
 Plot[  xxrot /. k -> -i2k@10 /. t -> t - 2 // Evaluate, {t, 0,
   4000 0.01}, PlotRange -> All, PlotStyle -> Red];
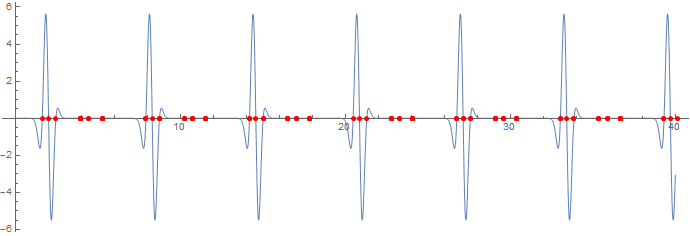
So I need to know in which values in x-axis I have the zero crossings of the function as accurately as possible.
I tried to make a table and use interpolation, but it obviously does not give accurate values.

