1. Problem statement
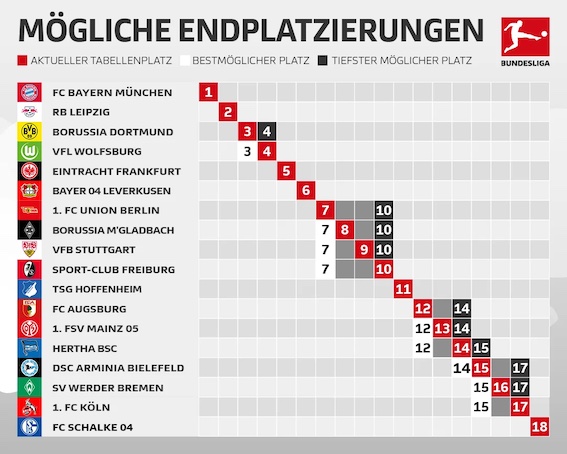
Some game days before the end of a league season I want to show the possible final rankings (depending upon the results of the outstanding games).
2. Example data (situation after the penultimate game day)
data =
  <|"Bayern" -> <|"High" -> 1, "Now" -> 1, "Low" -> 1|>,
   "Leipzig" -> <|"High" -> 2, "Now" -> 2, "Low" -> 2|>,
   "Dortmund" -> <|"High" -> 3, "Now" -> 3, "Low" -> 4|>,
   "Wolsburg" -> <|"High" -> 3, "Now" -> 4, "Low" -> 4|>,
   "Frankfurt" -> <|"High" -> 5, "Now" -> 5, "Low" -> 5|>,
   "Leverkusen" -> <|"High" -> 6, "Now" -> 6, "Low" -> 6|>,
   "Union" -> <|"High" -> 7, "Now" -> 7, "Low" -> 10|>,
   "Gladbach" -> <|"High" -> 7, "Now" -> 8, "Low" -> 10|>,
   "Stuttgart" -> <|"High" -> 7, "Now" -> 9, "Low" -> 10|>,
   "Freiburg" -> <|"High" -> 7, "Now" -> 10, "Low" -> 10|>,
   "Hoffenheim" -> <|"High" -> 11, "Now" -> 11, "Low" -> 11|>,
   "Augsburg" -> <|"High" -> 12, "Now" -> 12, "Low" -> 14|>,
   "Mainz" -> <|"High" -> 12, "Now" -> 13, "Low" -> 14|>,
   "Hertha" -> <|"High" -> 12, "Now" -> 14, "Low" -> 15|>,
   "Bielefeld" -> <|"High" -> 14, "Now" -> 15, "Low" -> 17|>,
   "Bremen" -> <|"High" -> 15, "Now" -> 16, "Low" -> 17|>,
   "Koeln" -> <|"High" -> 15, "Now" -> 17, "Low" -> 17|>,
   "Schalke" -> <|"High" -> 18, "Now" -> 18, "Low" -> 18|>|>;
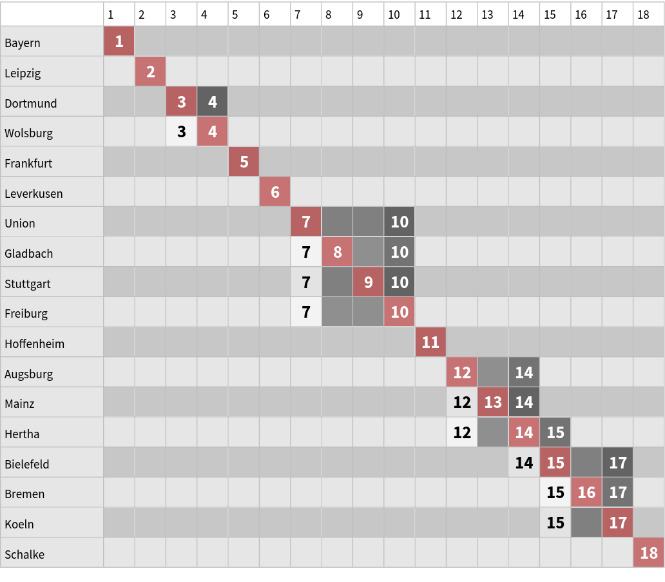
3. Corresponding Plot
- Red: Actual ranking
- White: Best possible ranking after last game day
- Black: Worst possible ranking after last game day
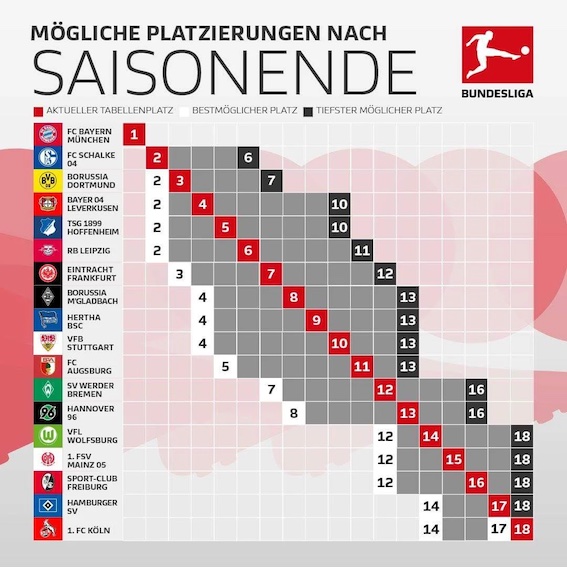
A few matchdays earlier the prediction bands might have looked like this:
4. Question
What could be possible ways to produce a similar Plot (except the logos)?


