7
$\begingroup$

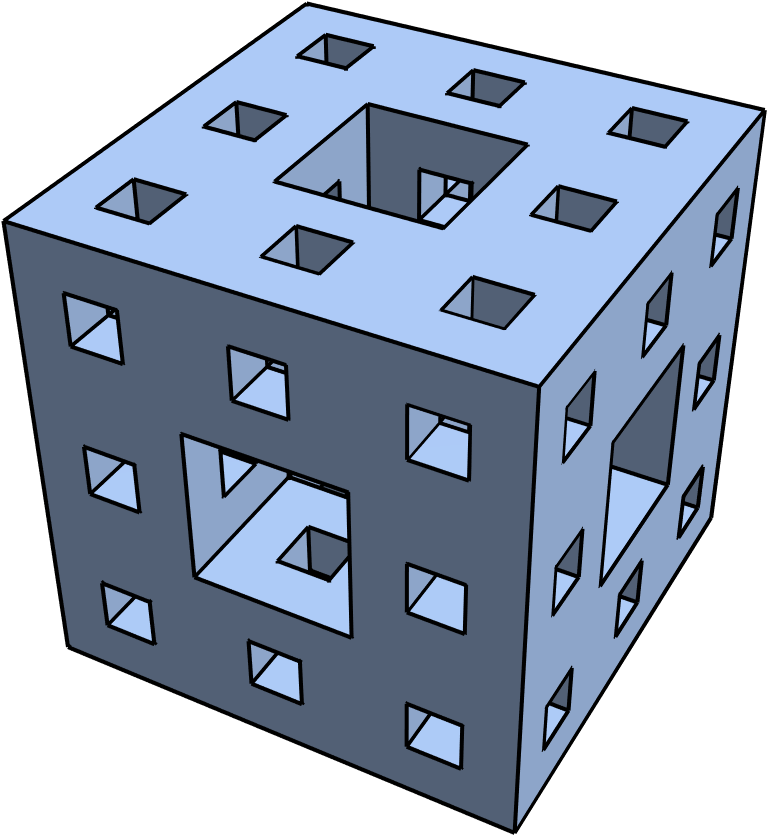
I want to generate a picture like this, highlight its outlines, don't show extra edges.
enter image description here
The built-in MengerMesh will have extra edges

mesh = MengerMesh[2, 3];
Graphics3D[{
  {EdgeForm[], mesh},
  {Thick, MeshPrimitives[mesh, 1]}
  }, Boxed -> False]

enter image description here
I've tried the method here, It seems that it doesn't work for regions with holes.

Region`Mesh`MergeCells[BoundaryDiscretizeRegion@MengerMesh[2, 3]]
$\endgroup$

2 Answers 2

12
$\begingroup$

3.

Inspired by chayong's answer, a direct way to identify the boundary edges using Region`Mesh`MeshCellNormals:

bmr = BoundaryMesh[MengerMesh[2, 3]];

boundaryedges = Pick[MeshPrimitives[bmr, 1], 
  Map[Unitize @ (1 - Max @ Abs @ #)&] @ Region`Mesh`MeshCellNormals[bmr, 1],1];


Show[bmr, Graphics3D[{AbsoluteThickness[3], boundaryedges}], Boxed -> False]

enter image description here

Alternatively, we identify the indices of boundary edges and highlight them using HighlightMesh:

boundaryindices = Pick[MeshCellIndex[bmr, 1][[All, 2]], 
  Map[Unitize @ (1 - Max @ Abs @ #)&] @ Region`Mesh`MeshCellNormals[bmr, 1], 1];

HighlightMesh[bmr, 
 Style[{1, boundaryindices}, Directive[Black, AbsoluteThickness[3]]]]

enter image description here

1.

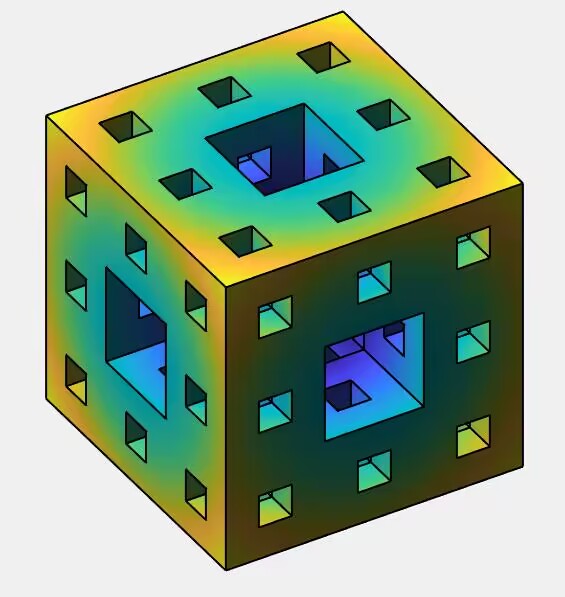
Combine co-planar faces and plot them using RegionPlot3D using the option BoundaryStyle:

bdm = BoundaryMesh @ MengerMesh[2, 3];

faces = MapApply[RegionUnion] @
   Gather[MeshPrimitives[bdm, 2], 
    CoplanarPoints[Join[First @ #, First @ #2]] &];
 
RegionPlot3D[Evaluate @ faces, 
 Mesh -> None, 
 MaxRecursion -> 5, 
 BoundaryStyle -> Directive[Thick, Black],
 Boxed -> False, 
 Lighting -> "Neutral",
 ViewProjection -> "Orthographic", 
 ColorFunctionScaling -> False, 
 ColorFunction -> 
   (ColorData["BlueGreenYellow"][5/3
      SquaredEuclideanDistance[{#, #2, #3}, {1, 1, 1}/2]] &)]

enter image description here

Remove the options ViewProjection,ColorFunctionScaling and ColorFunction to get

enter image description here

2.

Get RegionMember function for MengerMesh[2,3] and use it with RegionPlot3D:

rmf = RegionMember @ MengerMesh[2, 3]; 

RegionPlot3D[rmf @ {x, y, z},
 {x, 0, 1}, {y, 0, 1}, {z, 0, 1},
 Mesh -> None, 
 MaxRecursion -> 5,
 PlotPoints -> 200, 
 Boxed -> False, Axes -> False, 
 BoundaryStyle -> Thick, Lighting -> "Neutral"]

enter image description here

Note that, unlike the first method above, this method fails to style the interior edges.

$\endgroup$
5
$\begingroup$

Updated
BoundaryMesh is not needed, faster than the previous version

mesh = MengerMesh[4, 3];
idx = {1, 2, 2, 3, 3, 4, 4, 1, 5, 6, 6, 7, 7, 8, 8, 5, 1, 5, 2, 6, 3, 7, 4, 8};
outlines = MeshPrimitives[mesh, 3][[All, 1, idx]] //
    RightComposition[
     ArrayReshape[#, {Times @@ Dimensions@#/6, 2, 3}] &,
     Map[Sort],
     Tally,
     Cases[{x_, 1} :> x],
     Developer`ToPackedArray,
     Line
     ]; // AbsoluteTiming

Graphics3D[{
  {EdgeForm[], mesh},
  {Black, Tube[outlines, Scaled[1/1000]]}
  }, Boxed -> False, ImageSize -> 800, Lighting -> "Classic"]

{3.31279, Null}
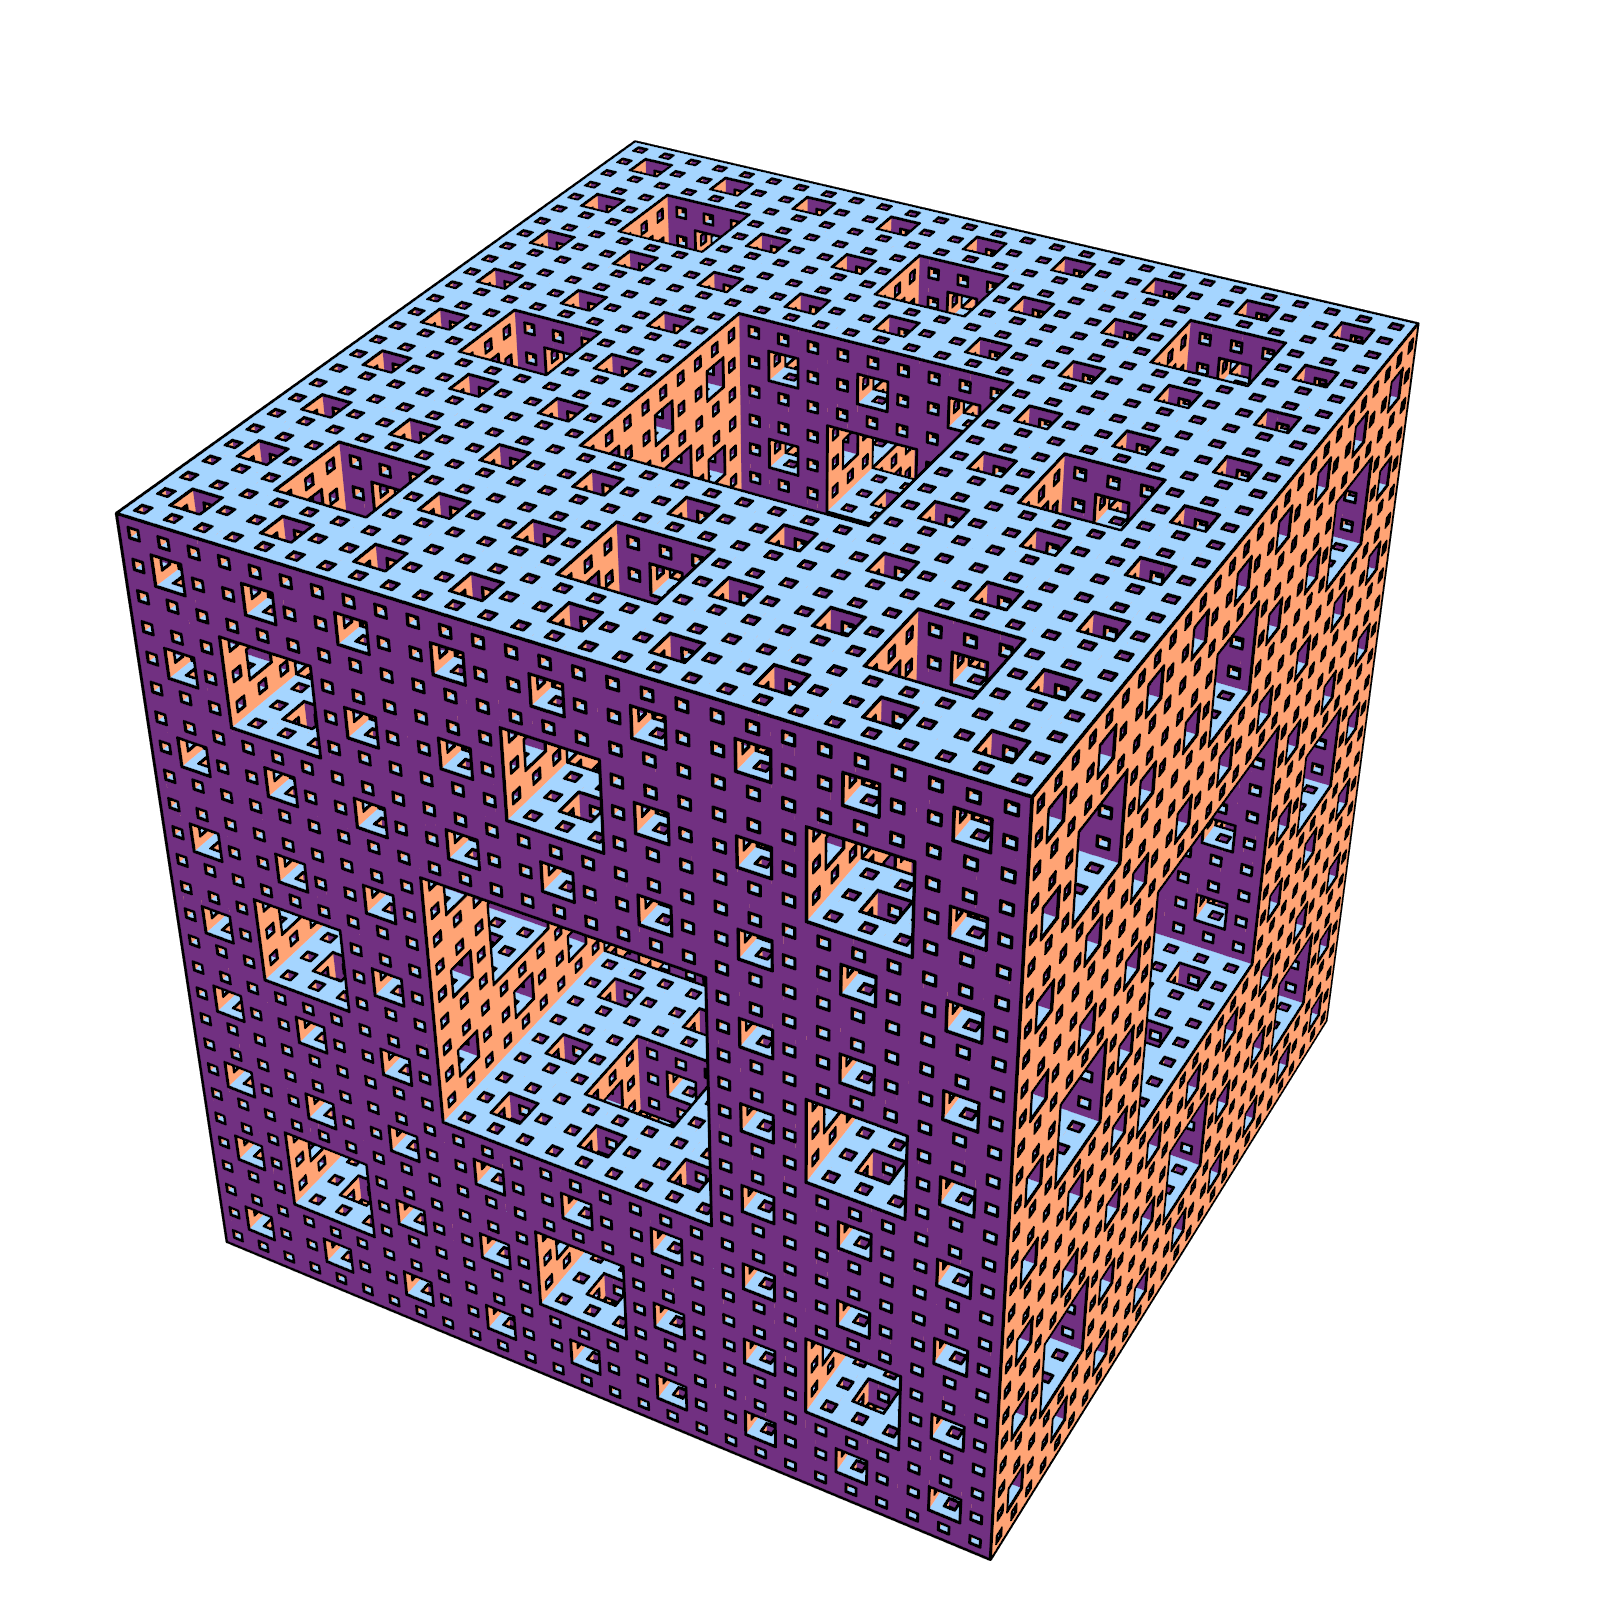
enter image description here


Using method in Extract 2D quad mesh from 3D hexahedral mesh, add some optimization

Clear[boundaryMeshOutlines];
boundaryMeshOutlines[bmr_BoundaryMeshRegion, tol_ : 0.] :=
  Module[{enormal, graph, edges, vl, adj, corneredges},
   enormal = Region`Mesh`MeshCellNormals[bmr, 2];
   graph = MeshConnectivityGraph[bmr, {1, 2}];
   edges = MeshCellIndex[bmr, 1];
   vl = VertexList[graph];
   adj = Lookup[AssociationThread[vl, Extract[vl, 
    List/@ AdjacencyMatrix[graph]["AdjacencyLists"]]], edges][[All, All, 2]];
   corneredges = Pick[edges, UnitStep[(Dot @@ enormal[[#]] & /@ adj) - 1 + tol], 0];
   MeshPrimitives[bmr, corneredges, "Multicells" -> True]
   ];

bmesh = BoundaryMesh[MengerMesh[3, 3]];
outlines = boundaryMeshOutlines[bmesh]; // AbsoluteTiming
Graphics3D[{
  {EdgeForm[], bmesh},
  {Black, Tube[#, Scaled[1/800]] & /@ outlines}
  }, Boxed -> False, ImageSize -> 600]

{0.30785, Null}
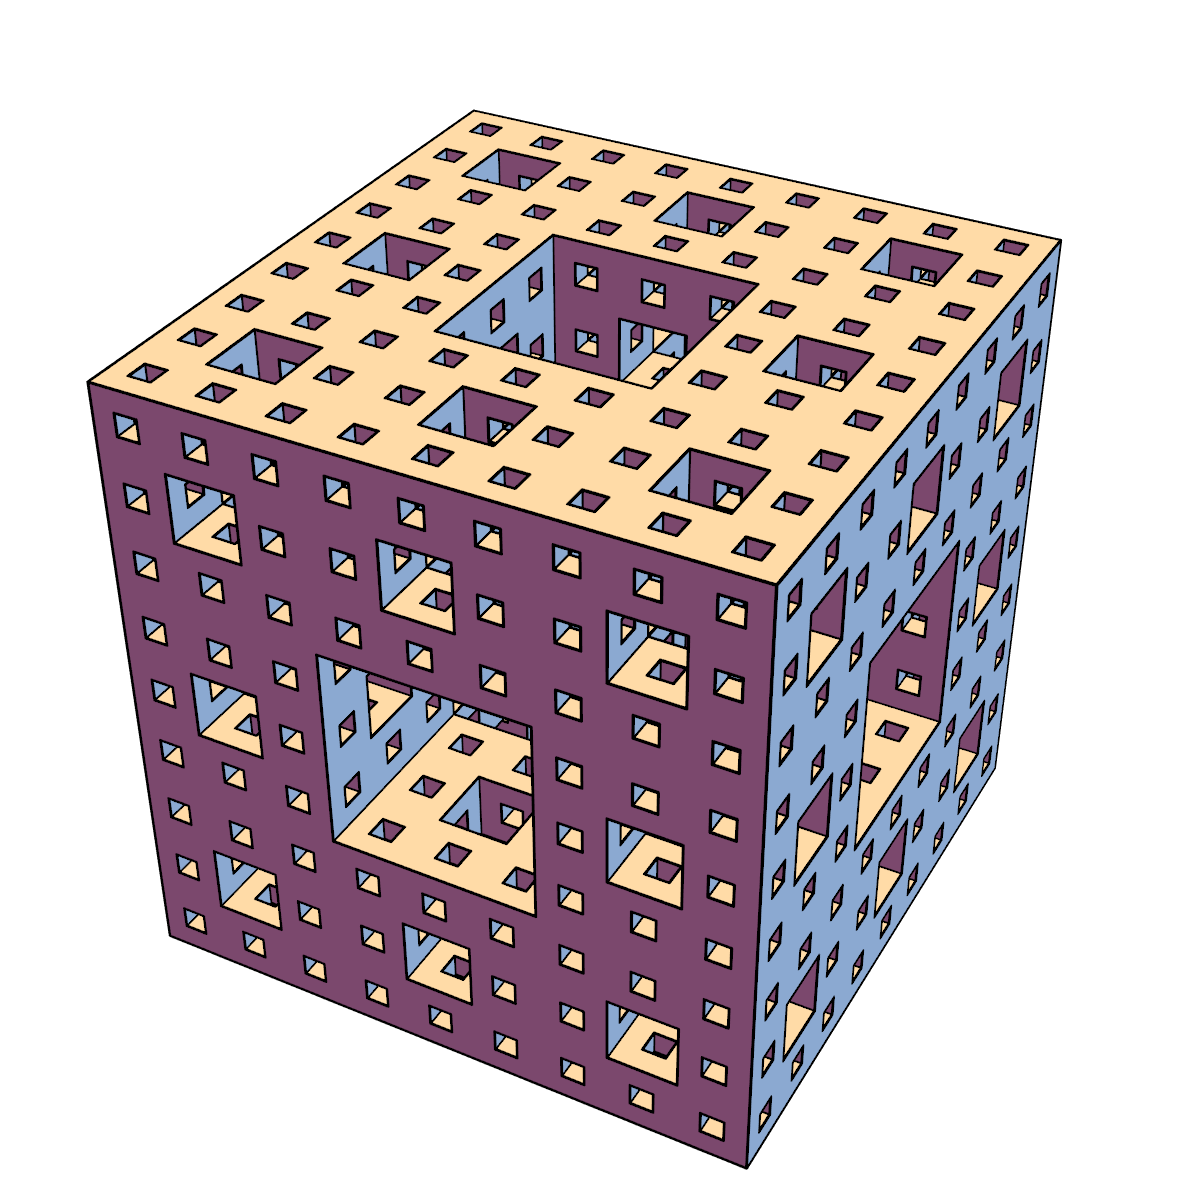
enter image description here

It also works for this Construct a polyhedron from the coordinates of its vertices and calculate the area of each face

q={{-10.,-7.5,-6.25},{-10.,-7.5,6.25},{-10.,0.,-10.},{-10.,0.,10.},{-10.,7.5,-6.25},{-10.,7.5,6.25},{-1.66667,-11.6667,-8.33333},{-1.66667,-11.6667,8.33333},{2.5,-13.75,0.},{-2.5,0.,-13.75},{1.66667,-8.33333,-11.6667},{-2.5,0.,13.75},{1.66667,-8.33333,11.6667},{-1.66667,11.6667,-8.33333},{1.66667,8.33333,-11.6667},{-1.66667,11.6667,8.33333},{1.66667,8.33333,11.6667},{2.5,13.75,0.},{10.,-10.,0.},{10.,-6.25,-7.5},{10.,-6.25,7.5},{10.,6.25,-7.5},{10.,6.25,7.5},{10.,10.,0.}};

bdm=BoundaryMesh@DelaunayMesh[q];

Graphics3D[{
  {EdgeForm[], bdm},
  {Black, 
   Tube[#, Scaled[1/800]] & /@ boundaryMeshOutlines[bdm, 10^-5.]}
  }, Boxed -> False, ImageSize -> 600]

enter image description here

$\endgroup$
2
  • $\begingroup$ How long do you get the output? $\endgroup$ Commented Jul 22, 2023 at 3:20
  • $\begingroup$ @minhthien_2016 Less than 4 seconds in total. $\endgroup$
    – chyanog
    Commented Jul 22, 2023 at 9:16

Your Answer

By clicking “Post Your Answer”, you agree to our terms of service and acknowledge you have read our privacy policy.

Not the answer you're looking for? Browse other questions tagged or ask your own question.