1
$\begingroup$

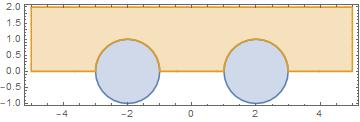
I want to calculate the time- and space- dependent temperature of a 2D system where there are 3 materials, with different thermal properties. The system can be described by the schematics:

MoltenFilm = Rectangle[{-4, 0}, {4, 2}];
centers = {{-2, 0}, {2, 0}};
Fib = RegionUnion[Disk[#, 1] & /@ centers];
Inter = RegionDifference[MoltenFilm, Fib];
RegionPlot[{Fib, Inter}, AspectRatio -> Automatic]

enter image description here

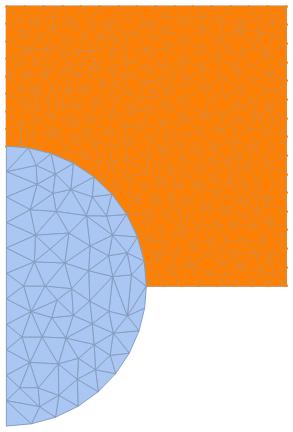
Actually, the system is periodic in the x direction. So one could just use this as repeat unit:

enter image description here

The thermal properties of the materials are are:

(*k is in W/mK; rho in Kg/m3; Cp in J/(kgK)*)
ka = 0.024; rhoa = 1.292; Cpa = 1003;   (*white area*)
kf = 0.33; rhof = 940; Cpf = 2100;      (*orange area*)
kr = 0.22; rhor = 1300; Cpr = 1300;     (*blue area*)

The initial condition of the system is (T is homogeneous inside each domain):

Tblue=40;
Twhite=20;
Torange=220;

As for boundary conditions, I am looking for:

  • Neumann boundary condition at the white-orange interface (y=0)
  • Neumann boundary condition at the white-orange interface (y=2)
  • Flux continuity at the orange-blue interface

Help in setting this up is appreciated.

$\endgroup$
2
  • $\begingroup$ Is this just theoretical question or solution also needed? $\endgroup$ Commented May 28, 2023 at 14:26
  • $\begingroup$ Hi, I know the theoretical elements of this transport phenomena problem. I am looking for an implementation in Mathematica 12. $\endgroup$
    – Luigi
    Commented May 29, 2023 at 17:19

1 Answer 1

5
$\begingroup$

We can solve this problem with Mathematica FEM as follows

Needs["NDSolve`FEM`"]

(*k is in W/mK;rho in Kg/m3;Cp in J/(kgK)*)ka = 0.024; rhoa = 1.292; \
Cpa = 1003;   (*white area*)
kf = 0.33; rhof = 940; Cpf = 2100;      (*orange area*)
kr = 0.22; rhor = 1300; Cpr = 1300;     (*blue area*)

reg1 = Disk[{2, 0}, 1]; reg2 = 
 RegionDifference[Rectangle[{0, 0}, {4, 2}], reg1];  reg = 
 Rectangle[{0, -1}, {4, 2}]; mesh = 
 ToElementMesh[reg, MaxCellMeasure -> 1/400];
Show[mesh["Wireframe"], Graphics[{{Opacity[0.5], Blue, reg1}}], 
 Graphics[{{Opacity[.25], Orange, Rectangle[{0, 0}, {4, 2}]}}]]
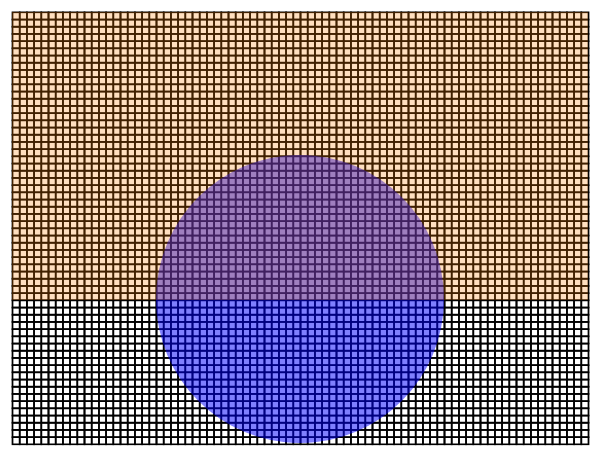
Figure 1

k[x_, y_] := 
 If[Element[{x, y}, reg2], kf, If[Element[{x, y}, reg1], kr, ka]]; 
rho[x_, y_] := 
 If[Element[{x, y}, reg2], rhof, 
  If[Element[{x, y}, reg1], rhor, rhoa]]; 
cp[x_, y_] := 
 If[Element[{x, y}, reg2], Cpf, If[Element[{x, y}, reg1], Cpr, Cpa]]; 
T0[x_, y_] := 
 If[Element[{x, y}, reg2], Torange, 
  If[Element[{x, y}, reg1], Tblue, Twhite]]

eq = Inactivate[
   cp[x, y] rho[x, y] D[T[x, y, t], t] - 
    Div[k[x, y] Grad[T[x, y, t], {x, y}], {x, y}], D | Div | Grad];

sol = NDSolve[{Activate[eq] == 0, T[x, y, 0] == T0[x, y]}, T, 
  Element[{x, y}, mesh], {t, 0, 10000}]

Visualization

Table[DensityPlot[Evaluate[T[x, y, t] /. sol[[1]]], 
  Element[{x, y}, mesh], ColorFunction -> "TemperatureMap", 
  PlotLegends -> Automatic, PlotRange -> All, 
  AspectRatio -> Automatic, PlotPoints -> 100, MaxRecursion -> 2, 
  PlotLabel -> Row[{"t = ", t}]], {t, 0, 10000, 2000}]
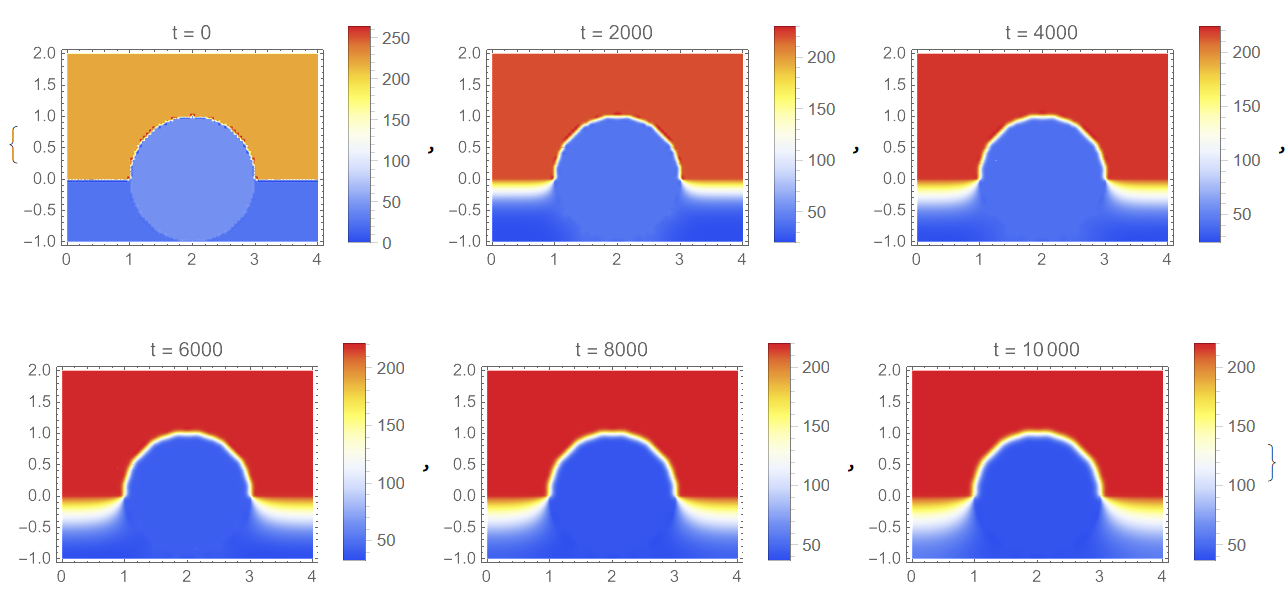
Figure 2

Update 1. In a case convection heart transfer on the air-solid interface the code should be modified as follows

Needs["NDSolve`FEM`"]

(*k is in W/mK;rho in Kg/m3;Cp in J/(kgK)*)ka = 0.024; rhoa = 1.292; \
Cpa = 1003;   (*white area*)
kf = 0.33; rhof = 940; Cpf = 2100;      (*orange area*)
kr = 0.22; rhor = 1300; Cpr = 1300;     (*blue area*)

Tblue = 40;
Twhite = 20;
Torange = 220;

reg1 = Disk[{2, 0}, 1]; reg2 = 
 RegionDifference[Rectangle[{0, 0}, {4, 2}], reg1]; reg = 
 RegionUnion[Rectangle[{0, 0}, {4, 2}], reg1]; mesh = 
 ToElementMesh[reg, MaxCellMeasure -> 1/400];
k[x_, y_] := If[Element[{x, y}, reg2], kf, kr]; 
rho[x_, y_] := If[Element[{x, y}, reg2], rhof, rhor]; 
cp[x_, y_] := If[Element[{x, y}, reg2], Cpf, Cpr]; 
T0[x_, y_] := If[Element[{x, y}, reg2], Torange, Tblue];

eq1 = cp[x, y] rho[x, y] D[T[x, y, t], t] - 
   Div[k[x, y] Grad[T[x, y, t], {x, y}], {x, y}];

h = 10^3; sol = 
 NDSolve[{eq1 == NeumannValue[h (Twhite - T[x, y, t]), y <= 0], 
   T[x, y, 0] == T0[x, y]}, T, Element[{x, y}, mesh], {t, 0, 10000}];

Visualization

Table[DensityPlot[Evaluate[T[x, y, t] /. sol[[1]]], 
  Element[{x, y}, mesh], ColorFunction -> "Rainbow", 
  PlotLegends -> Automatic, PlotRange -> All, 
  AspectRatio -> Automatic, PlotPoints -> 100, MaxRecursion -> 2, 
  PlotLabel -> Row[{"t = ", t}]], {t, 0, 10000, 2000}]
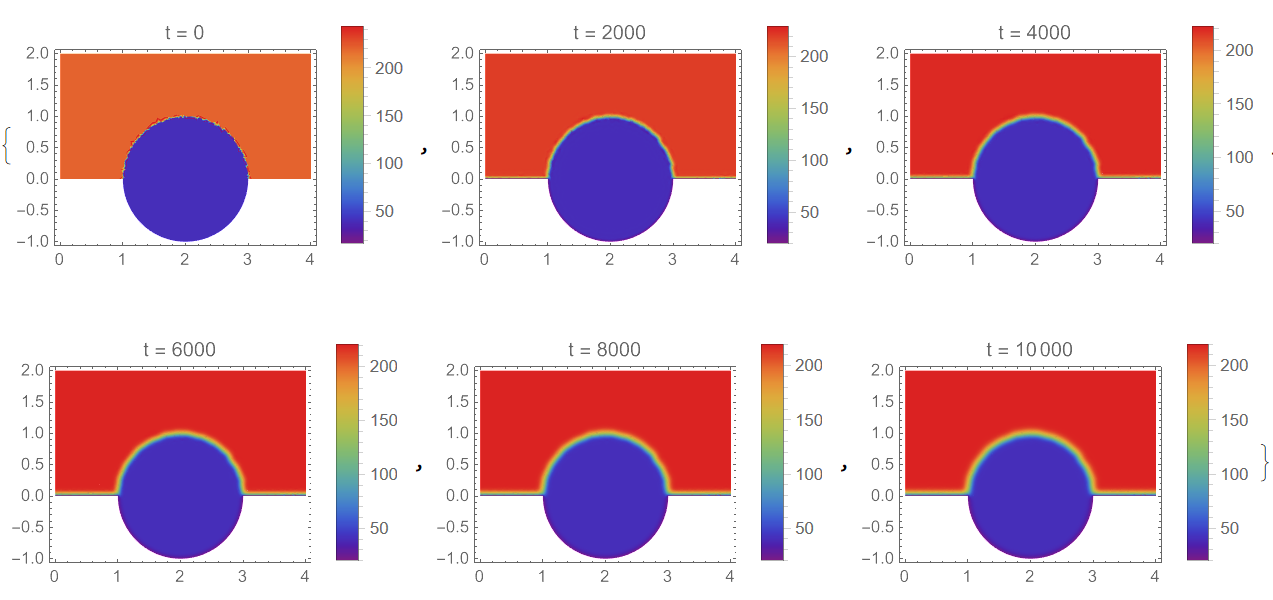
Figure 3

$\endgroup$
12
  • $\begingroup$ How can I identify the interface between the orange and white domain? I would like to test what happens when I fix the heat flux level over that interface, eg h*(Torange-Twhite), while the flux at the orange-blue interface remains unlimited. $\endgroup$
    – Luigi
    Commented May 29, 2023 at 17:21
  • $\begingroup$ @Luigi Do you mean that in the air region we have some convection flow? $\endgroup$ Commented May 30, 2023 at 1:19
  • $\begingroup$ yes. The heat exchange between the orange material and the white material (air) can be affected by convection. So I was thinking of simulating also the case where, over that interface, the flux is fixed. How to identify the interface? $\endgroup$
    – Luigi
    Commented May 30, 2023 at 7:05
  • 1
    $\begingroup$ @Luigi Do you mean that we can neglect by air-flow and therefore can describe air temperature as a given value? $\endgroup$ Commented May 31, 2023 at 4:17
  • 1
    $\begingroup$ Please, see Update 1 to my answer. $\endgroup$ Commented May 31, 2023 at 8:26

Your Answer

By clicking “Post Your Answer”, you agree to our terms of service and acknowledge you have read our privacy policy.

Not the answer you're looking for? Browse other questions tagged or ask your own question.