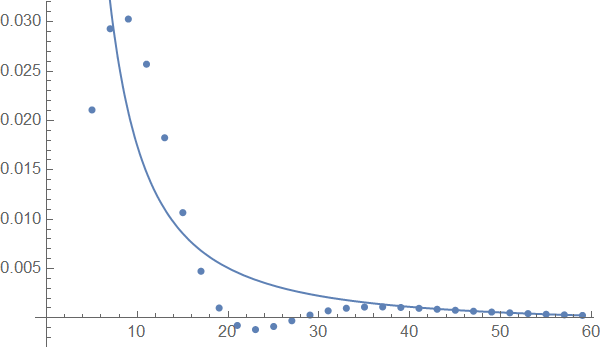
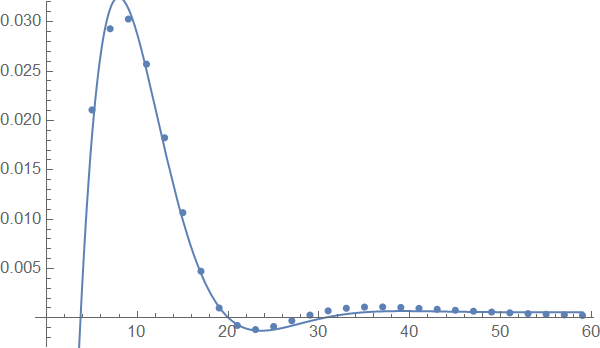
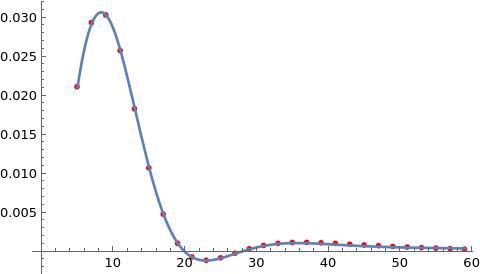
I have a set of data points. The first coordinate is time and the second coordinate is energy. I am trying to figure out how the energy is decaying over time. Particularly, I have to find if it is decaying over time exponentially or as a power law. I used Mathematica FindFit to model my points as both an exponential decay and a power law decay. It turned out that the exponential decay describes my data points better. But I am not sure if I am doing the right thing. I also plotted my data points in a ListLogPlot and ListLogLogPlot. In both cases, I got a straight line. So, I am a little confused about the actual behavior of my data points. Could anyone help me with this issue? I am copying my data points here. Note that I am only interested in the late-time behavior of the function, not the entire time axis. Thank you!
Data1={{5,0.0210796},{7,0.0293022},{9,0.0302858},{11,0.0257149},{13,0.0182589},{15,0.0106745},{17,0.00473577},{19,0.00101295},{21,-0.000754187},{23,-0.00117344},{25,-0.000860244},{27,-0.000278088},{29,0.000293337},{31,0.00072545},{33,0.000988823},{35,0.00110603},{37,0.00111822},{39,0.00106582},{41,0.000980234},{43,0.000882181},{45,0.000783367},{47,0.000689278},{49,0.0006018},{51,0.000521108},{53,0.000446822},{55,0.000378596},{57,0.000316303}, {59, 0.000259989190761133}}


