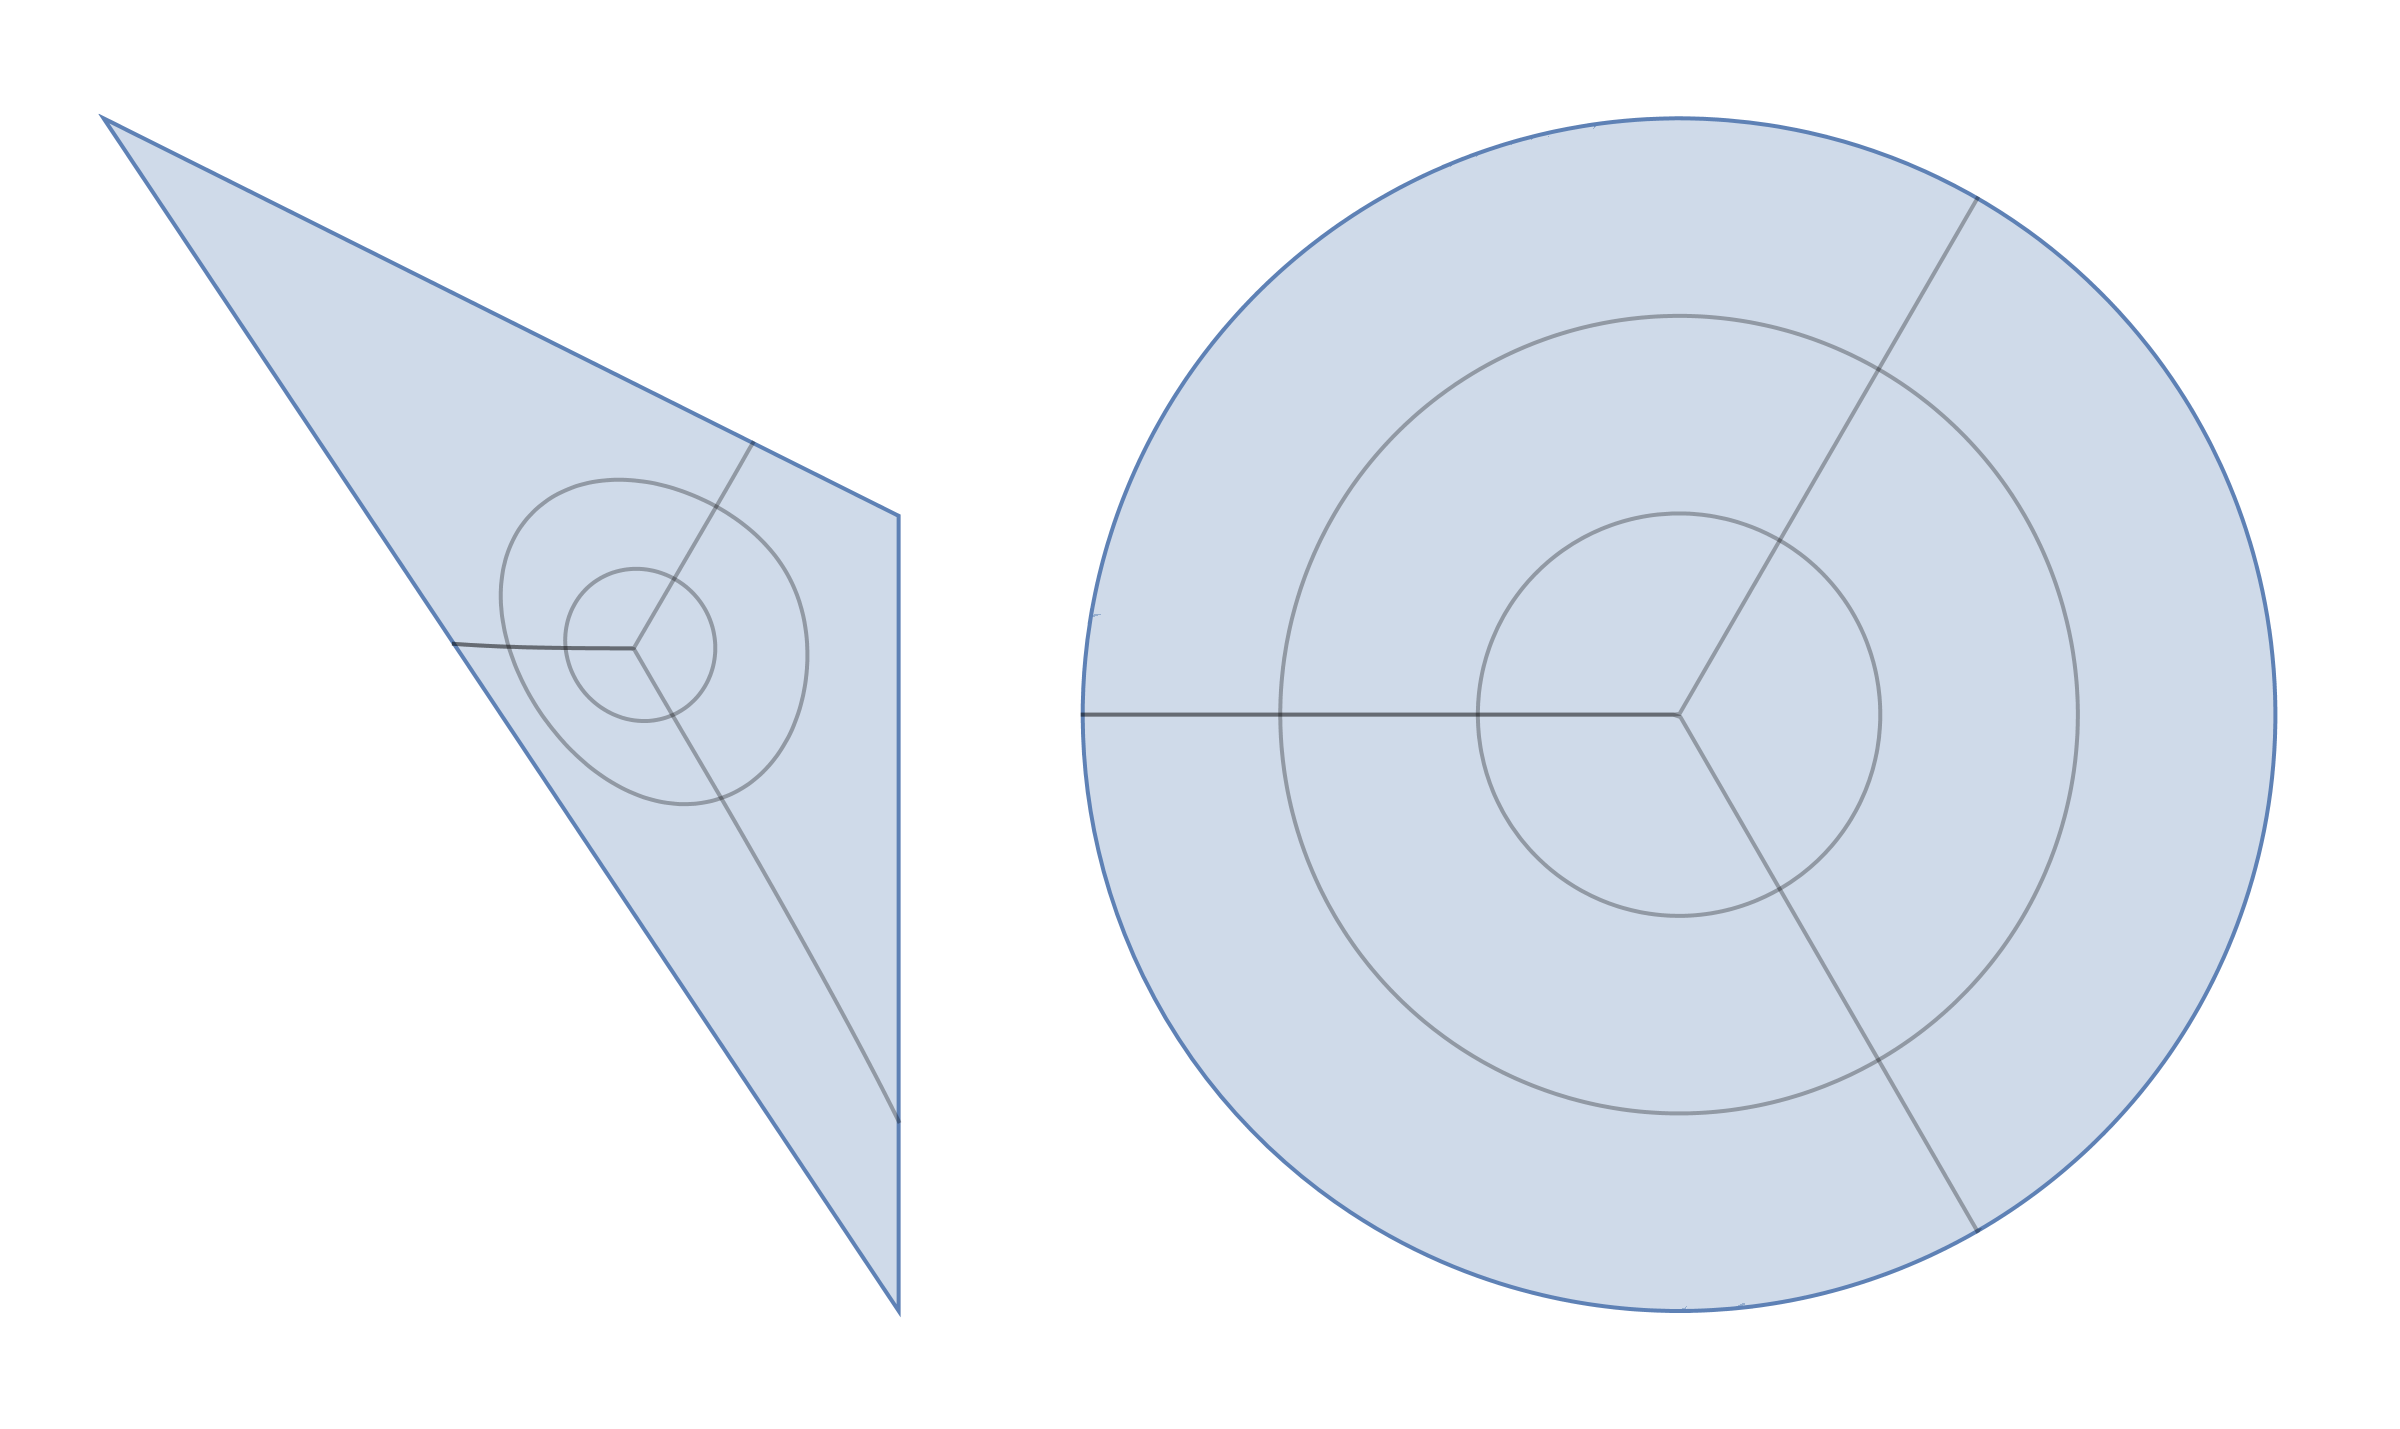
We can use PI algorithm described in the paper Numerical Conformal Mapping with Rational Functions.The function for conformal mapping can be computed as follows
Needs["NDSolve`FEM`"];
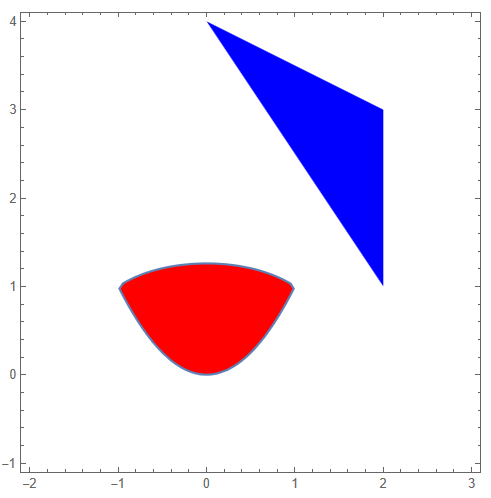
reg1 = Triangle[{{2, 1}, {2, 3}, {0, 4}}]; reg2 =
 ImplicitRegion[x^2 + y^3 < 2 && y > x^2, {x, y}];

f[reg_, order_] :=
  Module[{Z, A, B, eq, g, vec, mat, sol, R1, z1, bndedges,
    bndvertices, bpts, b, b0, aa, bb}, z1 = N@RegionCentroid[reg];
   R1 = ToElementMesh[reg, "MaxBoundaryCellMeasure" -> .01,
     "MaxCellMeasure" -> .001];
   bndedges = R1["BoundaryElements"][[1, 1]];
   bndvertices = Sort@DeleteDuplicates[Flatten[bndedges]];
   bpts = R1["Coordinates"][[bndvertices]];
   b = ConstantArray[0., Length[R1["Coordinates"]]];
   b0 = b[[
      bndvertices]] = -0.5 Log[
       Total[(bpts - ConstantArray[z1, Length[bpts]])^2, {2}]];

   With[{nn = order},
    Z = {x, y} |-> Table[ComplexExpand[(x + I y)^n], {n, 0, nn}];
    A = Array[aa, {nn + 1}]; B = Array[bb, {nn + 1}];
    g = {x, y} |-> ComplexExpand[(A + I B) . Z[x, y]]];

   eq = -b0 + (g[#[[1]] - z1[[1]], #[[2]] - z1[[2]]] & /@ bpts) /.
     I -> 0;

   {vec, mat} = CoefficientArrays[Join[{bb[1]}, eq], Join[A, B]];

   sol = LeastSquares[mat, -vec];
   With[{nn = order},
    Do[aa[i] = sol[[i]];
     bb[i] = sol[[nn + 1 + i]];, {i, nn + 1}]]; {{x, y} |->
     ReIm[Evaluate[
       ComplexExpand[((x + I y) - (z1[[1]] + I  z1[[2]]))  Exp[
          g[x - z1[[1]], y - z1[[2]]]]]]], {x, y} |->
     ComplexExpand[(A + I B) . Z[x, y]], z1, R1}];
Example of usage
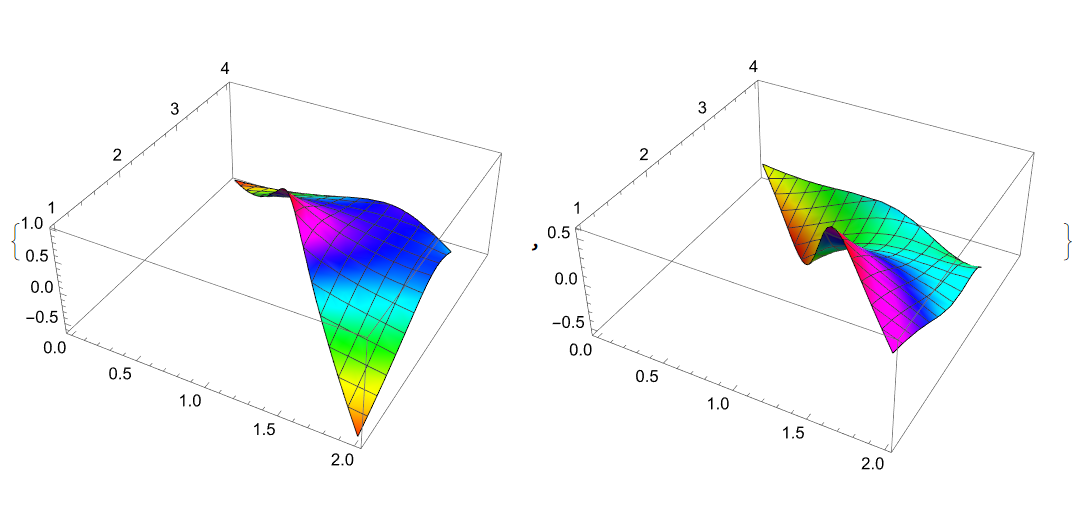
{f1, g1, z1, mesh1} = f[reg1, 32];

{Plot3D[Evaluate[g1[x - z1[[1]], y - z1[[2]]]] // Re,
  Element[{x, y}, reg1], ColorFunction -> Hue],
 Plot3D[Evaluate[g1[x - z1[[1]], y - z1[[2]]]] // Im,
  Element[{x, y}, reg1], ColorFunction -> Hue]}
{f2, g2, z2, mesh2} = f[reg2, 32];

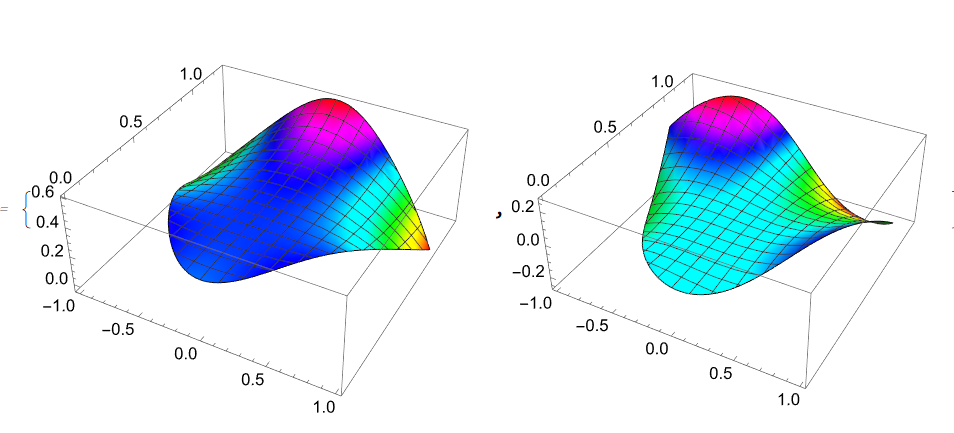
{Plot3D[Evaluate[g2[x - z2[[1]], y - z2[[2]]]] // Re,
  Element[{x, y}, reg2], ColorFunction -> Hue],
 Plot3D[Evaluate[g2[x - z2[[1]], y - z2[[2]]]] // Im,
  Element[{x, y}, reg2], ColorFunction -> Hue]}
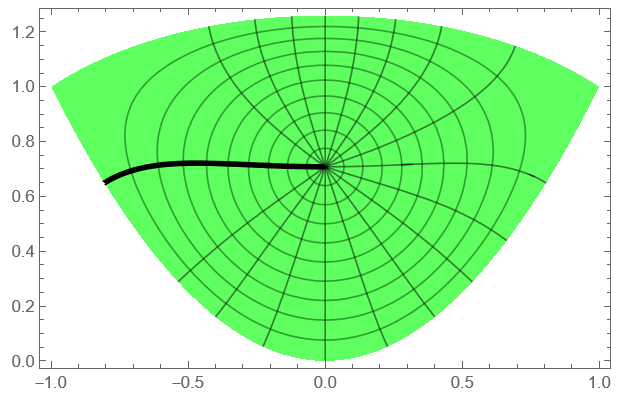
 Mesh lines on
 reg2
rho2 = ContourPlot[Abs[f2[x, y]], Element[{x, y}, reg2],
   Contours -> Range[.1, .9, .1],
   ColorFunction -> Function[{x, y}, Hue[1/3, 1, 1, .5]],
   AspectRatio -> Automatic];

arg2 = ContourPlot[Arg[f2[x, y]], Element[{x, y}, reg2],
   Contours -> Pi  Range[-.8, .8, .1],
   ColorFunction -> Function[{x, y}, Hue[1/3, 1, 1, .25]],
   AspectRatio -> Automatic, ExclusionsStyle -> Black];

Show[rho2, arg2]
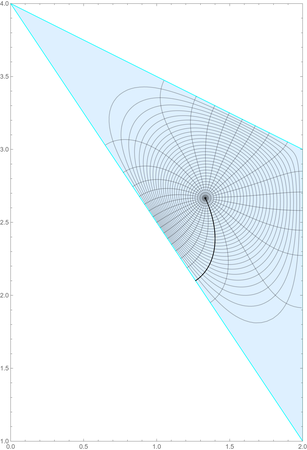
Mesh lines on reg1
rho1 = ContourPlot[Abs[f1[x, y]], Element[{x, y}, reg1],
  Contours -> Range[.1, .9, .1],
  ColorFunction -> Function[{x, y}, Hue[1/3, 1, 1, .5]],
  AspectRatio -> Automatic];

arg1 = ContourPlot[Arg[f1[x, y]], Element[{x, y}, reg1],
  ColorFunction -> Function[{x, y}, Hue[1/3, 1, 1, .25]],
  AspectRatio -> Automatic, Contours -> Pi Range[-.8, .8, .1],
  PlotPoints -> 50];
Show[rho1, arg1]
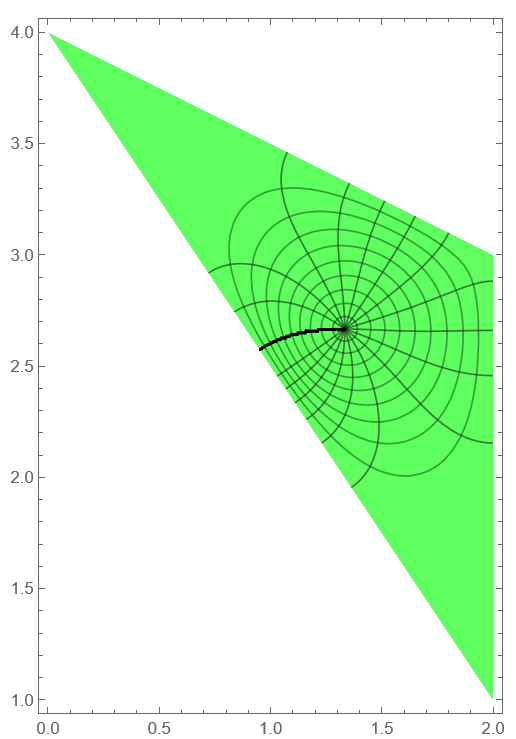
First attempt.
We can try approach that recommended by yarchik and implemented by
Henrik Schumacher here. We have
Needs["NDSolve`FEM`"];
reg1 = Triangle[{{2, 1}, {2, 3}, {0, 4}}]; reg2 =
 ImplicitRegion[x^2 + y^3 < 2 && y > x^2, {x, y}];
f[reg_] :=
 Module[{R, p, z0, ufun, vfun},
  R = ToElementMesh[reg, "MeshOrder" -> 1,
    "MaxBoundaryCellMeasure" -> .01, "MaxCellMeasure" -> .001];
  z0 = N@RegionCentroid[reg];
  (*Initialization of Finite Element Method*)
  vd = NDSolve`VariableData[{"DependentVariables",
      "Space"} -> {{u}, {x, y}}];
  sd = NDSolve`SolutionData[{"Space"} -> {R}];
  cdata =
   InitializePDECoefficients[vd, sd,
    "DiffusionCoefficients" -> {{-IdentityMatrix[2]}},
    "MassCoefficients" -> {{1}}];
  bcdata =
   InitializeBoundaryConditions[vd,
    sd, {DirichletCondition[u[x, y] == 0., True]}];
  mdata = InitializePDEMethodData[vd, sd];

  (*Discretization*)
  dpde = DiscretizePDE[cdata, mdata, sd];
  dbc = DiscretizeBoundaryConditions[bcdata, mdata, sd];
  {load, stiffness, damping, mass} = dpde["All"];
  DeployBoundaryConditions[{load, stiffness}, dbc];

  (*Preparation of Dirichlet boundary conditions for u*)

  bndedges = R["BoundaryElements"][[1, 1]];
  bndvertices = Sort@DeleteDuplicates[Flatten[bndedges]];
  bpts = R["Coordinates"][[bndvertices]];
  b = ConstantArray[0., Length[R["Coordinates"]]];
  b[[bndvertices]] = -0.5 Log[
     Total[(bpts - ConstantArray[z0, Length[bpts]])^2, {2}]];

  (*Solving the system and creating an interpolating function*)

  solver = LinearSolve[stiffness, Method -> "Pardiso"];
  uvals = solver[b];
  ufun = ElementMeshInterpolation[{R}, uvals];
  (*Preparation of Neumann boundary conditions for v*)
  gradu = {x, y} |-> Evaluate[D[ufun[x, y], {{x, y}, 1}]];
  J = N@RotationMatrix[Pi/2];
  p = R["Coordinates"];
  {i, j} = Transpose[R["BoundaryElements"][[1, 1]]];
  normalprojections =
   MapThreadDot[
    R["BoundaryNormals"][[
     1]], (gradu @@@ (0.5 (p[[i]] + p[[j]]))) . (-J)];
  boundaryedgelengts = Sqrt[Total[(p[[i]] - p[[j]])^2, {2}]];
  {\[Alpha], \[Beta]} = Transpose[bndedges];
  vertexbndedgeconnectivity =
   SparseArray[
    Transpose[{Join[\[Alpha], \[Beta]],
       Join[Range[Length[\[Alpha]]], Range[Length[\[Beta]]]]}] ->
     1, {Length[p], Length[bndedges]}];

  (*Solving the system and creating an interpolating function*)

  b = vertexbndedgeconnectivity . (normalprojections \
boundaryedgelengts);
  vvals = solver[b];
  vfun = ElementMeshInterpolation[{R}, vvals];
  {x, y} |->
   Evaluate[
    ComplexExpand[
     ReIm[((x + I y) - (z0[[1]] + I z0[[2]])) Exp[
        ufun[x, y]] (Cos[vfun[x, y]] + I  Sin[vfun[x, y]])]]]];
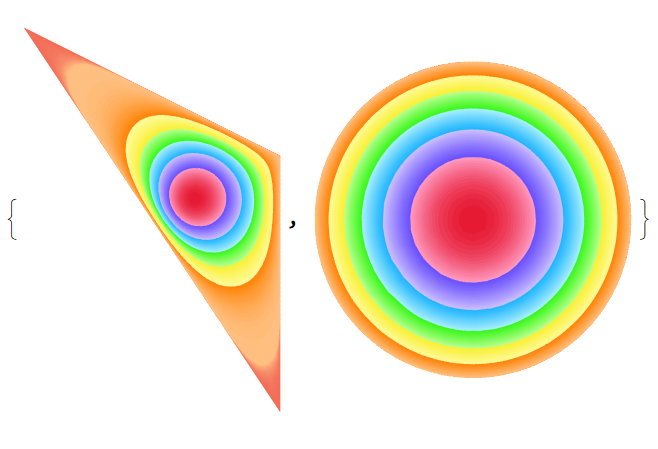
We use function f at reg1, reg2 as follows
f1 = f[reg1];

With[{R =
   ToElementMesh[reg1, "MeshOrder" -> 1,
    "MaxBoundaryCellMeasure" -> .01, "MaxCellMeasure" -> .001]},
 p = R["Coordinates"];
 tex = ColorData["BrightBands", "Image"];
 texcoords =
  Transpose[{Total[(f1 @@@ p)^2, {2}], ConstantArray[0.5, Length[p]]}];
 g1 = {Graphics[{Texture[tex],
     ElementMeshToGraphicsComplex[R,
      VertexTextureCoordinates -> texcoords]}, PlotRange -> All],
   Graphics[{Texture[tex],
     ElementMeshToGraphicsComplex[R,
      VertexTextureCoordinates -> texcoords,
      "CoordinateConversion" -> (f1 @@@ # &)]}]}]
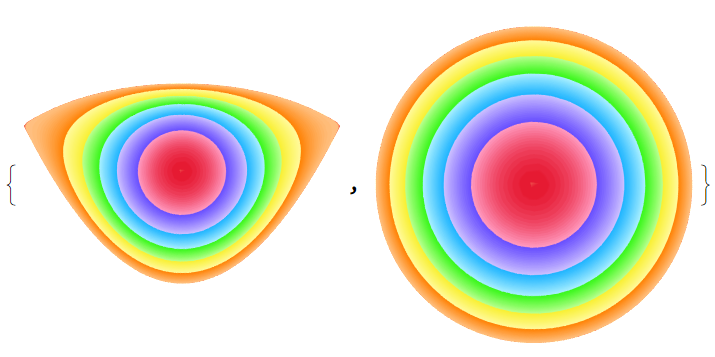
f2 = f[reg2];

With[{R =
   ToElementMesh[reg2, "MeshOrder" -> 1,
    "MaxBoundaryCellMeasure" -> .01, "MaxCellMeasure" -> .001]},
 p = R["Coordinates"];
 tex = ColorData["BrightBands", "Image"];
 texcoords =
  Transpose[{Total[(f2 @@@ p)^2, {2}], ConstantArray[0.5, Length[p]]}];
 g1 = {Graphics[{Texture[tex],
     ElementMeshToGraphicsComplex[R,
      VertexTextureCoordinates -> texcoords]}, PlotRange -> All],
   Graphics[{Texture[tex],
     ElementMeshToGraphicsComplex[R,
      VertexTextureCoordinates -> texcoords,
      "CoordinateConversion" -> (f2 @@@ # &)]}]}]
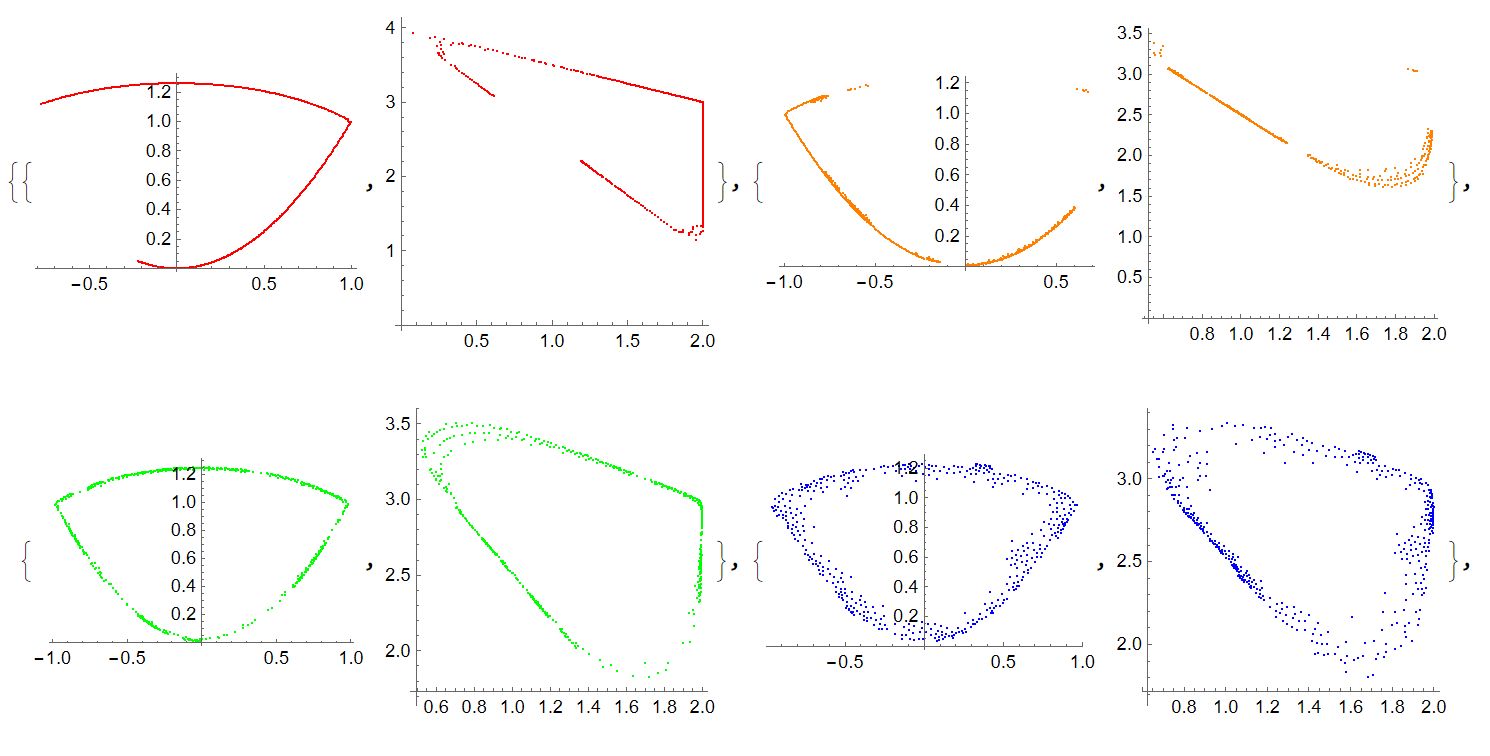
Nothing new above, but now we can map reg2 to reg1 using FindRoot
z0 = N@RegionCentroid[reg2];

ps = Sort[p, Norm[# - z0] &];

ds = f2[#[[1]], #[[2]]] & /@ ps;

z1 = N@RegionCentroid[reg1];
ps1 = Table[{x, y} /.
    Quiet@FindRoot[
      f1[x, y] == ds[[i]], {x, z1[[1]]}, {y, z1[[2]]}], {i,
    Length[ds]}];
Visualization
kmax = First[Last[Length[ps] // FactorInteger]];

nmax = Length[ps]/kmax;

{ListPlot[
  Table[Take[ps, {kmax  i + 1, kmax  (i + 1)}], {i, 0, nmax - 1}],
  PlotStyle -> cl],
 ListPlot[
  Table[Take[ps1, {kmax  i + 1, kmax  (i + 1)}], {i, 0, nmax - 1}],
  AspectRatio -> 1, PlotStyle -> cl, PlotLegends -> Automatic]}
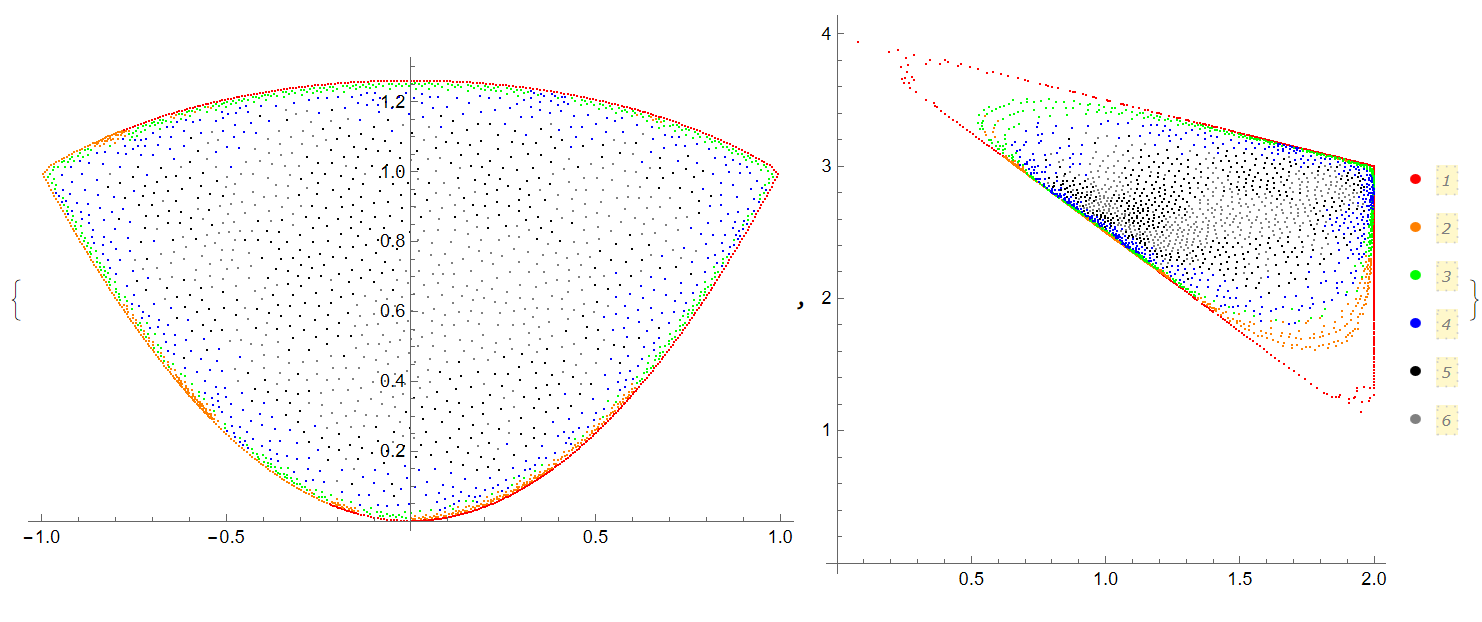
We also can check how parts of reg2 map at reg
cl = {Red, Orange, Green, Blue, Black, Gray};

Table[{ListPlot[Take[ps, {kmax  i + 1, kmax  (i + 1)}],
   PlotStyle -> cl[[i + 1]]],
  ListPlot[Take[ps1, {kmax  i + 1, kmax  (i + 1)}], AspectRatio -> 1,
   PlotStyle -> cl[[i + 1]]]}, {i, 0, nmax - 1}]
Update 1. Given the pictures that the user cvgmt provided us (thanks to him), we need to check how Schumacher's code calculates the functions ufun, vfun. For this we used NDSolve and our code with PI algorithm implemented in it - see paper Numerical Conformal Mapping with Rational Functions. NDSolve code is very simple
Needs["NDSolve`FEM`"];
reg1 = Triangle[{{2, 1}, {2, 3}, {0, 4}}]; reg2 =
 ImplicitRegion[x^2 + y^3 < 2 && y > x^2, {x, y}];

z1 = N@RegionCentroid[reg1]; R1 =
 ToElementMesh[reg1, "MaxBoundaryCellMeasure" -> .01,
  "MaxCellMeasure" -> .001];
U1 = NDSolveValue[{-Laplacian[u[x, y], {x, y}] == 0,
    DirichletCondition[
     u[x, y] == -.5 Log[(x - z1[[1]])^2 + (y - z1[[2]])^2], True]}, u,
    Element[{x, y}, R1]];
Plot3D[U1[x, y], Element[{x, y}, reg1], ColorFunction -> Hue]
The PI algorithm is based on the series expansion of a function $g(z)=u(z)+i v(z)$, where $\nabla^2 u=0$ with the Dirichlet condition $u=-\ln|z-z1|$. To compute $u,v$ we use mesh R1 generated above:
bndedges = R1["BoundaryElements"][[1, 1]];
bndvertices = Sort@DeleteDuplicates[Flatten[bndedges]];
bpts = R1["Coordinates"][[bndvertices]];
b = ConstantArray[0., Length[R1["Coordinates"]]];
b0 = b[[bndvertices]] = -0.5 Log[
     Total[(bpts - ConstantArray[z1, Length[bpts]])^2, {2}]];

With[{nn = 32},
  Z = {x, y} |-> Table[ComplexExpand[(x + I y)^n], {n, 0, nn}];
  A = Array[aa, {nn + 1}]; B = Array[bb, {nn + 1}];
  g = {x, y} |-> ComplexExpand[(A + I B) . Z[x, y]]];

eq = -b0 + (g[#[[1]] - z1[[1]], #[[2]] - z1[[2]]] & /@ bpts) /. I -> 0;

{vec, mat} = CoefficientArrays[Join[{bb[1]}, eq], Join[A, B]];

sol = LeastSquares[mat, -vec];
With[{nn = 32},
  Do[aa[i] = sol[[i]]; bb[i] = sol[[nn + 1 + i]];, {i, nn + 1}]];
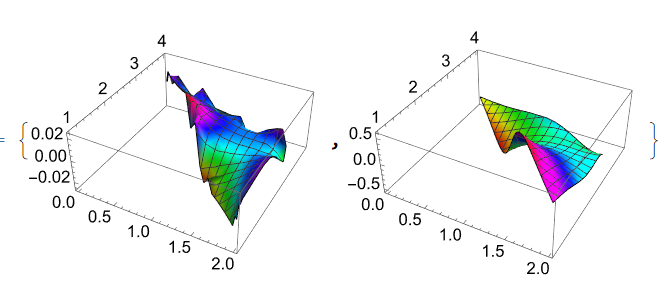
Now we can compare U1 computed with NDSolve, ufun computed with Henrik Schumacher code (function f above), and function u=Re[g[z-z1]]
{Plot3D[U1[x, y], Element[{x, y}, reg1], ColorFunction -> Hue],
 Plot3D[ufun[x, y], Element[{x, y}, reg1], ColorFunction -> Hue],
 Plot3D[Evaluate[g[x - z1[[1]], y - z1[[2]]]] // Re,
  Element[{x, y}, reg1], ColorFunction -> Hue]}
Fortunately all 3 functions look same

But unfortunately functions vfun and Im[g[z-z1]] are differ
{Plot3D[vfun[x, y], Element[{x, y}, reg1], ColorFunction -> Hue],
 Plot3D[Evaluate[g[x - z1[[1]], y - z1[[2]]]] // Im,
  Element[{x, y}, reg1], ColorFunction -> Hue]}
 Using
Using g[z] computed above we can define conformal mapping reg1 on the unit disk as follows
f1p = {x, y} |->
   ReIm[Evaluate[
     ComplexExpand[((x + I y) - (z1[[1]] + I  z1[[2]]))  Exp[
        g[x - z1[[1]], y - z1[[2]]]] ]]];
Finally we test f1p using code provided by cvgmt
disktoreg1 =
  ParametricPlot[{x, y}, {x, y} \[Element] reg1,
   MeshFunctions -> {Function[{x, y},
      Norm@{Indexed[f1p[x, y], 1], Indexed[f1p[x, y], 2]}],
     Function[{x, y},
      ArcTan @@ {Indexed[f1p[x, y], 1], Indexed[f1p[x, y], 2]}]},
   Frame -> False, Axes -> False, Mesh -> {30, 30}];
reg1todisk =
  ParametricPlot[f1p[x, y], {x, y} \[Element] reg1,
   MeshFunctions -> {Function[{x, y}, Norm@{x, y}],
     Function[{x, y}, ArcTan @@ {x, y}]}, Frame -> False,
   Axes -> False, Mesh -> {30, 30}];
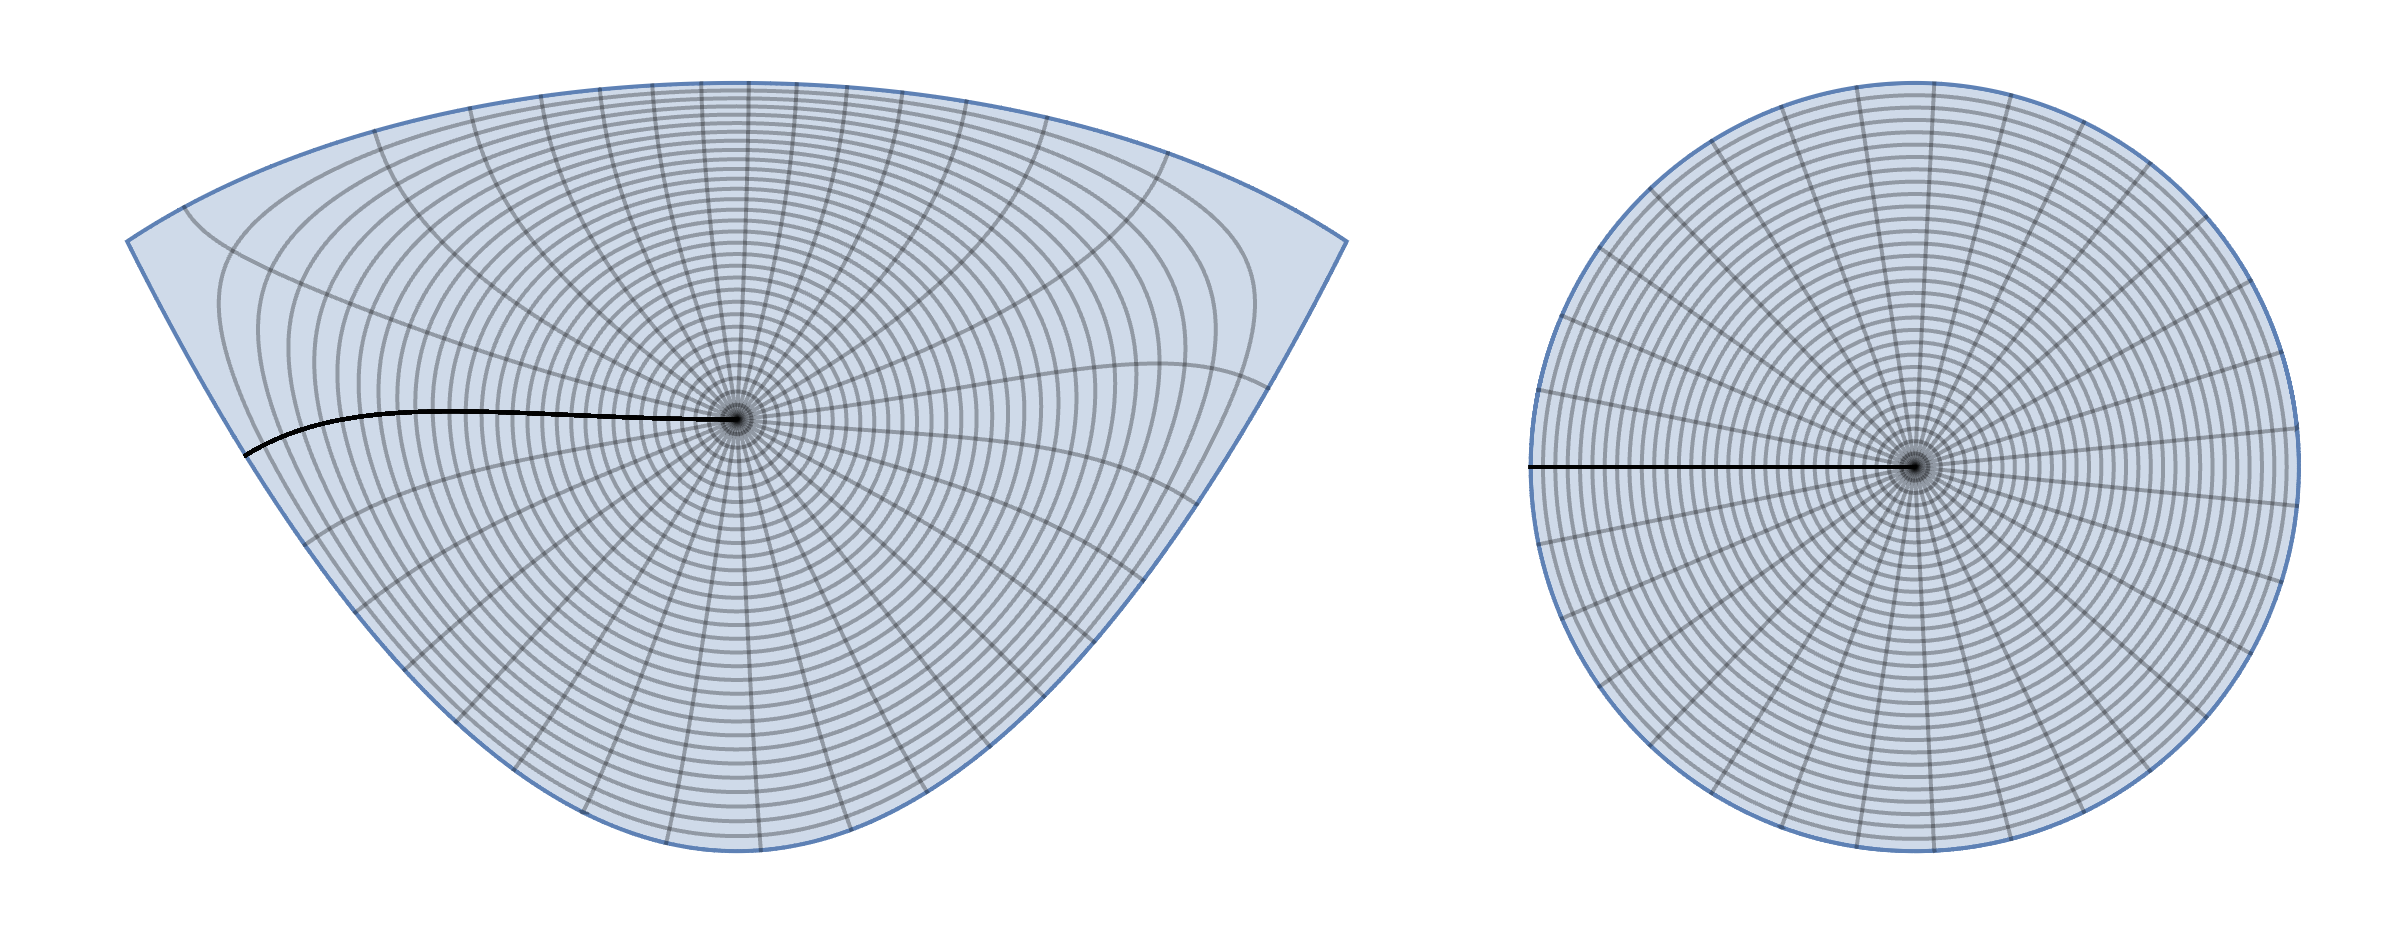
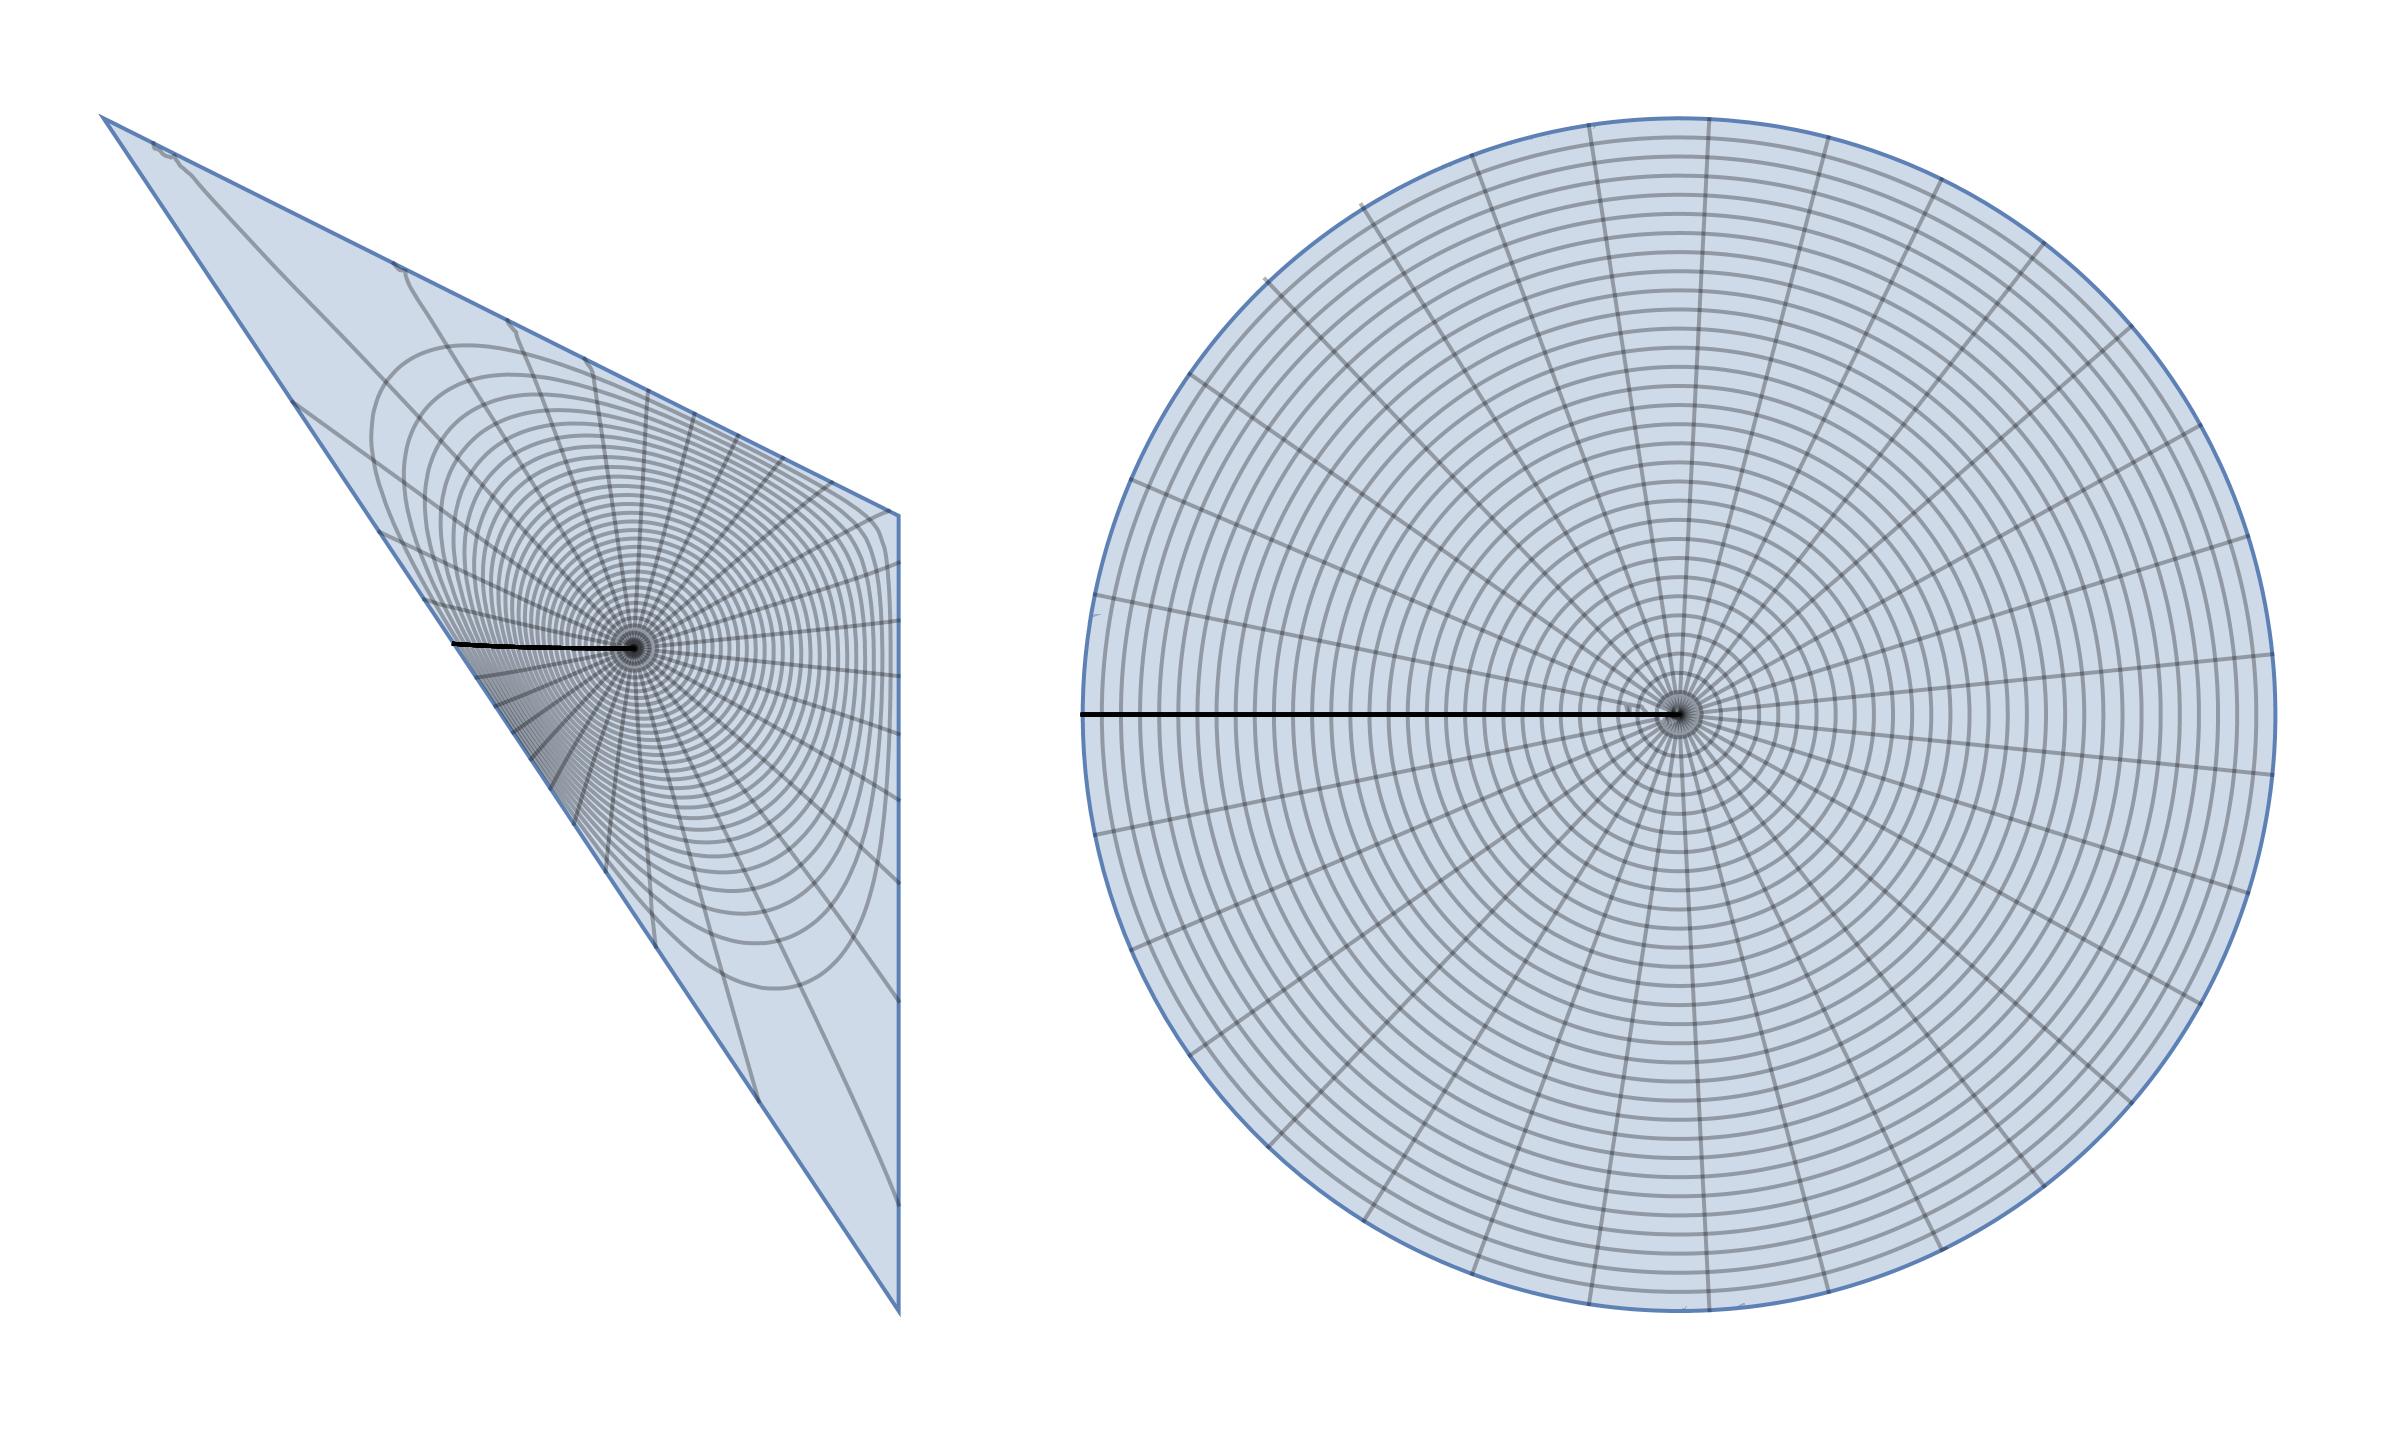
GraphicsRow[{disktoreg1, reg1todisk}]
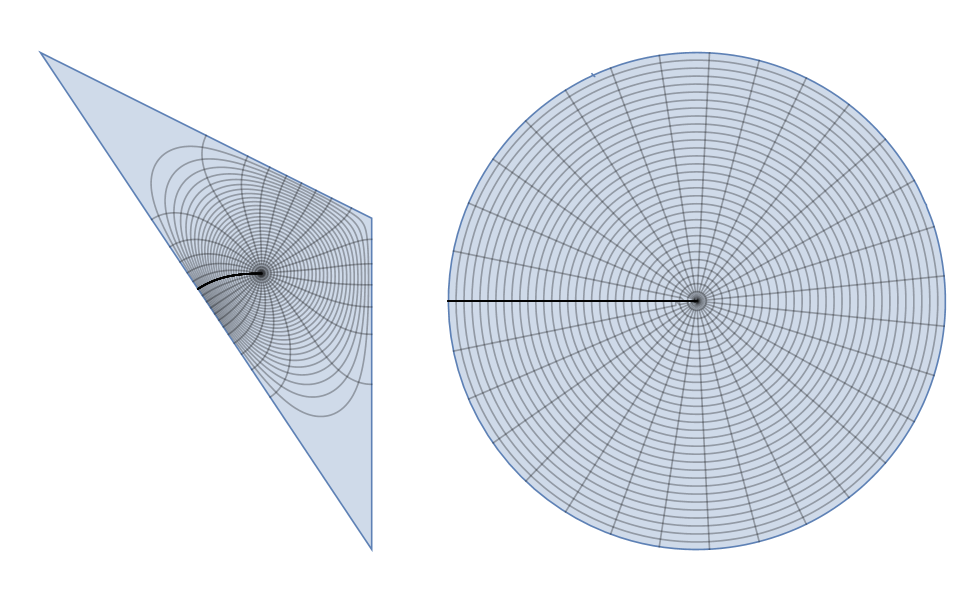
Now it looks like conformal map since all grid lines are orthogonal.
It is clear that function vfun computed with higher error and we need to improve code for f. On the other hand we can use more simple approach based on PI algorithm.
The result of the reg2.
