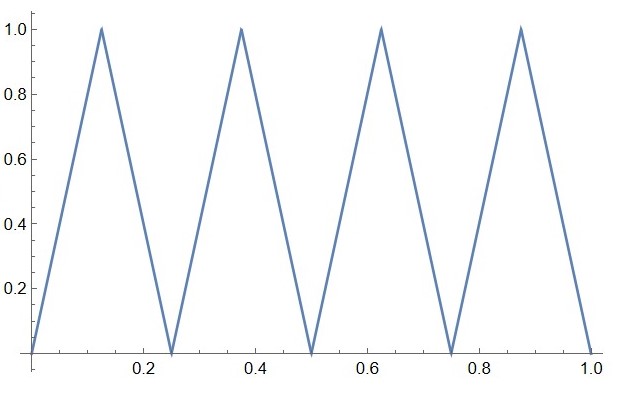
I have defined two functions: g, which is a piecewise function, and h, which is the composition of g.
g = Piecewise[{{2 x, x < 1/2}, {2*(1 - x), x > 1/2}}]
h = g@*g@*g@x
I want to plot two functions. I used the command Plot[g, {x, 0, 1}] and Plot[h, {x, 0, 1}]. The first one was successful while the second one failed.


