1
$\begingroup$

Suppose we want an interactive plot for the code:

Clear["Global`*"]
b = 3 (* b is an integer from 2 to 10 *)
x1 = 0 
x2 = 1  
y1 = 0
y2 = 1 (* x1,x2,y1,y2 are real numbers which represent the subspace 
           [x1,x2] x [y1,y2] of R^2*)

(*The functions below are "preliminary functions" of the true 
  function I wish to graph (note k is a real number)*)

s = Max[{Floor[Log[b, RealAbs[x1]]], 
   Floor[Log[b, 
     RealAbs[x2]]]}]
g1[xr_, r_] := 
 g1[xr, r] = 
  Round[(10^(s + 1)/b) Sin[r xr] + (10^(s + 1)/b)]

(* Below is the true function I wish to graph *)

f[x_, k_] := 
 f[x, k] = 
  N[y2 - ((y2 - y1)/(10^(s + 1))) Sum[
      g1[Sum[RealDigits[x, b, k, -r][[1]][[z]], {z, r + 1 - s, k}], 
        r + 1 - s]/b^r, {r, s, 8}]]
p1= 10000 (* We want this to be the integer approaching infinity *)
p = (x2-x1)/p1 (*The increment of the x-values between x1+p 
and x2 which we're graphing *)
ListPlot[Table[{x, f[x, 20]}, {x, x1 + p, x2, p}]] (*Graph of f we want
to convert to an interactive plot*)

Similar to the answer to this question, we want b,x1,x2,y1,y2,k, p1 and q to be sliders. We define points $(q_1,q_2)$, where $x_1\le q_1\le x_2$ and $y_1\le q_2\le y_2 $ such that slider $z\in\mathbb{R}$ zoom in point $(q_1,q_2)$ of ListPlot of $f$

I looked into the documentation for manipulation but couldn't find any options for zooming. Despite this, I used the the answer stated here.

Attempt:

Using this answer, I tried the following but I got an undefined output:

Clear["Global`*"]

(* Preliminary Functions *)
(* b, x1, x2, y1, y2, z, p1, q are now variables of a function*)
s[b_, x1_, x2_] := 
 s[b, x1, x2] = 
  Max[{Floor[Log[b, RealAbs[x1]]], Floor[Log[b, RealAbs[x2]]]}]
g1[b_, x1_, x2_, xr_, r_] := 
 g1[b, x1, x2, xr, r] = 
  Round[(10^(s[b, x1, x2] + 1)/b) Sin[r xr] + (10^(s[b, x1, x2] + 1)/
      b)]

(*Below is the true function I wish to graph*)

f[b_, x1_, x2_, y1_, y2_, x_, k_] := 
 f[b, x1, x2, y1, y2, x, k] = 
  N[y2 - ((y2 - y1)/(10^(s[b,x1,x2]+ 1))) Sum[
      g1[b, x1, x2, 
        Sum[RealDigits[x, b, k, -r][[1]][[z]], {z, 
          r + 1 - s[b, x1, x2], k}], r + 1 - s[b, x1, x2]]/b^r, {r, 
       s[b, x1, x2], 8}]]

(* Below is the interactive graph *)

Manipulate[t = -Log[z]; 
 ListPlot[Table[{q[[1]] + q[[2]] x - t - t x, 
    f[b, x1, x2, y1, y2, q[[1]] + q[[2]] x + t + t x, k]}, {x, 
    x1 + (x2 - x1)/p1, x2, (x2 - x1)/p1}]], {b, 2, 10, 1}, {x1, -5, 
  5}, {x2, -5, 5}, {y1, -5, 5}, {y2, -5, 5}, {k, 1, 20, 1}, {p1, 1, 
  50000}, {{z, 0.50, "zoom"}, 0, 
  0.999}, {q, {x1, x2}, {y1, y2}}]

Perhaps this was meant for complex-valued functions. How do we fix this (or find a better code)?

Edit: I made a typo in my code but I still get an undefined output.

**Second Edit: See my answer. I wish to convert the interactive plot into a hyperlink."

$\endgroup$
5
  • $\begingroup$ This might be relevant mathematica.stackexchange.com/q/7142/9469 $\endgroup$
    – yarchik
    Commented Jan 11, 2023 at 8:05
  • $\begingroup$ @yarchik Looking back, I don't necessarily want the plot to zoom in using the mouse. I wish for a code similar to the answer to this question $\endgroup$
    – Arbuja
    Commented Feb 5, 2023 at 0:00
  • $\begingroup$ @Arbuja You try to manipulate with f while there is a typo in f definition with usage function s here N[y2 - ((y2 - y1)/(10^(s + 1))). It should be s[b, x1, x2]. $\endgroup$ Commented Feb 6, 2023 at 3:52
  • $\begingroup$ @AlexTrounev Fixed it, but I still get an undefined graph. $\endgroup$
    – Arbuja
    Commented Feb 6, 2023 at 4:12
  • $\begingroup$ @Arbuja There are too many variables in your code. Try to fix all parameters and look how the interactive zoom working. Then add parameters one by one. This range is too large {p1, 1, 50000}. I think, that you can do it up to 1000 only. $\endgroup$ Commented Feb 6, 2023 at 4:22

3 Answers 3

3
+100
$\begingroup$

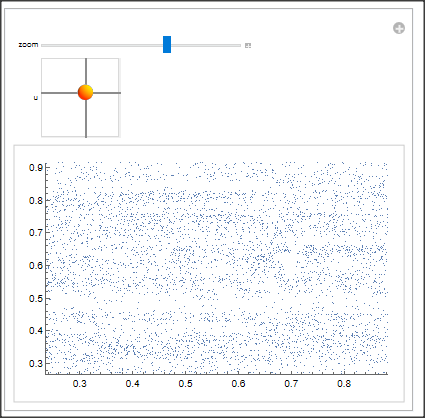
Something like:

tab = Table[{x, f[x, 20]}, {x, x1 + p, x2, p}];
Manipulate[
 ListPlot[tab, 
  PlotRange -> {{Max[0, u[[1]] - b], 
     Min[1, u[[1]] + b]}, {Max[0, u[[2]] - b], Min[1, u[[2]] + b]}}] 
 , {{b, 0.25, "zoom"}, 0.01, 
  0.5}, {{u, {0.25, 0.25}}, {0, 0}, {1, 1}}]

enter image description here

$\endgroup$
3
  • $\begingroup$ How do we convert the interactive plot into a hyperlink? (More specifically, a URL.) $\endgroup$
    – Arbuja
    Commented Feb 6, 2023 at 18:34
  • $\begingroup$ You can not directly link a plot to a URL. Only web pages can have a URL. Therefore, you may include a plot into a web page und hyperlink the web page. $\endgroup$ Commented Feb 6, 2023 at 19:28
  • $\begingroup$ I will give you the bounty since you directly answered my first question. $\endgroup$
    – Arbuja
    Commented Feb 9, 2023 at 23:03
2
$\begingroup$

All you have to do is sign in to your Mathematica account on your browser, then wrap your Manipulate expression with CloudDeploy as follows:

CloudDeploy[Manipulate[expr,{u,u_min,u_max}]]

So, for you it will simply be

CloudDeploy[Manipulate[
 ListPlot[tab[x1, x2, y1, y2, b, k, p], 
  PlotRange -> {{Max[0, q[[1]] - z], 
     Min[1, q[[1]] + z]}, {Max[0, q[[2]] - z], 
     Min[1, q[[2]] + z]}}], {{x1, 0, "x1"}, -1, 
  1}, {{x2, 1, "x2: x2>x1"}, -1, 1}, {{y1, 0, "y1"}, -1, 
  1}, {{y2, 1, "y2: y2>y1"}, -1, 1}, {b, 2, 10, 1}, {k, 1, 20, 
  1}, {{p, 20000, 
   "p: p is an integer where (x2-x1)/p is an increment between each \
x-value graphed"}, 1000, 20000}, {{z, 1, "zoom"}, 0.01, 
  1}, {{q, {0.5, 0.5}}, {0, 0}, {1, 1}}]]

Your output will then be the hyperlink your looking for. It'll look like this

CloudObject["https://www.wolframcloud.com/obj/a3920bcd-b23f-4bd1-80ab-\
d36e77ad0b72"]

You can then use the "Share" option to generate the URL, or even a QR code that you can share with whom you wish.

$\endgroup$
1
  • $\begingroup$ @chicago.physicists Thanks! I eventually figured this out. I should have updated my answer. $\endgroup$
    – Arbuja
    Commented Feb 9, 2023 at 23:03
0
$\begingroup$

Using @Daniel Hubers answer, this is the answer I am looking for:

Clear["Global`*"] 

(* Preliminary Function *)    

s[x1_, x2_, b_] := 
 s[x1, x2, b] = 
  Max[{Floor[Log[b, RealAbs[x1]]], 
    Floor[Log[b, 
      RealAbs[x2]]]}] 
g1[x1_, x2_, b_, xr_, r_] := 
 g1[x1, x2, b, xr, r] = 
  Round[(10^(s[x1, x2, b] + 1)/b) Sin[r xr] + (10^(s[x1, x2, b] + 1)/
      b)] 
f[x1_, x2_, y1_, y2_, b_, x_, k_] := 
 f[x1, x2, y1, y2, b, x, k] = 
  N[y2 - ((y2 - y1)/(10^(s[x1, x2, b] + 1))) RealAbs[
      Sum[g1[x1, x2, b, 
          Sum[RealDigits[x, b, k, -r][[1]][[z]], {z, 
            r + 1 - s[x1, x2, b], k}], r + 1 - s[x1, x2, b]]/b^r, {r, 
         s[x1, x2, b], 8}] - 
       10^(s[x1, x2, b] + 1)]]
tab[x1_, x2_, y1_, y2_, b_, k_, p_] := 
  tab[x1, x2, y1, y2, b, k, p] = 
   Table[{x, f[x1, x2, y1, y2, b, x, k]}, {x, x1 + (x2 - x1)/p, 
     x2, (x2 - x1)/p}];

(* Below is the interactive plot *)

Manipulate[
 ListPlot[tab[x1, x2, y1, y2, b, k, p], 
  PlotRange -> {{Max[0, q[[1]] - z], 
     Min[1, q[[1]] + z]}, {Max[0, q[[2]] - z], 
     Min[1, q[[2]] + z]}}], {{x1, 0, "x1"}, -1, 
  1}, {{x2, 1, "x2: x2>x1"}, -1, 1}, {{y1, 0, "y1"}, -1, 
  1}, {{y2, 1, "y2: y2>y1"}, -1, 1}, {b, 2, 10, 1}, {k, 1, 20, 
  1}, {{p, 20000, 
   "p: p is an integer where (x2-x1)/p is an increment between each \
x-value graphed"}, 1000, 20000}, {{z, 1, "zoom"}, 0.01, 
  1}, {{q, {0.5, 0.5}}, {0, 0}, {1, 1}}]

However, I wish to convert the interactive plot into a hyperlink.

$\endgroup$

Your Answer

By clicking “Post Your Answer”, you agree to our terms of service and acknowledge you have read our privacy policy.

Not the answer you're looking for? Browse other questions tagged or ask your own question.