2
$\begingroup$

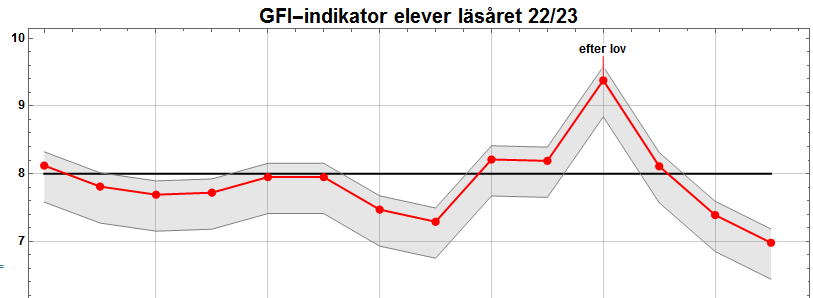
why doesn't call out point show confidence bands?

why doesn't callout show confidence bands? All data have the same length but to no avail regarding confidence band for callout point

data = {8.12, 7.81, 7.69, 7.72, 7.95, 7.95, 7.47, 7.29, 8.21, 8.19, 
Callout[9.38, "efter lov", Above], 8.11, 7.39, 6.98}; Length[data]
level = 8 {1, 1, 1, 1, 1, 1, 1, 1, 1, 1, 1, 1, 1, 1}; Length[level]
varianslista = {2.80, 3.56, 4.85, 3.98, 3.86, 5.1, 5.65, 4.97, 2.9, 
3.12, 0.65, 3.82, 4.78, 4.56}; Length[varianslista]
nlista = {67, 58, 61, 54, 65, 56, 57, 59, 34, 63, 16, 65, 46, 46};
varians = 1.93^2; n = 62;
ListLinePlot[{level, data, data + 0.83 Sqrt[varians/n], 
data - 2.2 Sqrt[varians/n]}, Filling -> {3 -> {4}}, 
PlotStyle -> {Directive[Black, Thick],
Directive[Red, Thick], Directive[Gray, Tiny], 
Directive[Gray, Small]}, GridLines -> Automatic,
Frame -> True, 
PlotMarkers -> {None, {Graphics[Disk[]], .02}, None, None}, 
ImageSize -> 800, 
PlotLabel -> Style["GFI-indikator elever läsåret 22/23", Black, 20],
LabelStyle -> Directive[Bold, Black, 12], 
DataRange -> {0, Length[data] - 1}, PlotRange -> {3, 10}]
$\endgroup$
1
  • 1
    $\begingroup$ Welcome to the Mathematica Stack Exchange. Please include Mathematica code (not an image) that would replicate the picture shown in the OP. Thanks. $\endgroup$
    – Syed
    Commented Dec 5, 2022 at 11:05

1 Answer 1

6
$\begingroup$

The reason why it does not work and the plots get broken is traceable to the following where a Callout can't be added to an integer.

data + 0.83 Sqrt[varians/n]

{8.32344, 8.01344, 7.89344, 7.92344, 8.15344, 8.15344, 7.67344,
7.49344, 8.41344, 8.39344, 0.203442 + Callout[9.38, "efter lov", Above], 8.31344, 7.59344, 7.18344}

data - 2.2 Sqrt[varians/n]

{7.58076, 7.27076, 7.15076, 7.18076, 7.41076, 7.41076, 6.93076,
6.75076, 7.67076, 7.65076, -0.539243 + Callout[9.38, "efter lov", Above], 7.57076, 6.85076, 6.44076}


The Callout can be used separately and so with minor rearrangement:

data = {8.12, 7.81, 7.69, 7.72, 7.95, 7.95, 7.47, 7.29, 8.21, 8.19, 
   9.38, 8.11, 7.39, 6.98};
level = 8 {1, 1, 1, 1, 1, 1, 1, 1, 1, 1, 1, 1, 1, 1}
varianslista = {2.80, 3.56, 4.85, 3.98, 3.86, 5.1, 5.65, 4.97, 2.9, 
  3.12, 0.65, 3.82, 4.78, 4.56}
nlista = {67, 58, 61, 54, 65, 56, 57, 59, 34, 63, 16, 65, 46, 46}
varians = 1.93^2
n = 62;

ListLinePlot[{level, data, data + 0.83 Sqrt[varians/n], 
  data - 2.2 Sqrt[varians/n], 
  Callout[{{10, 9.38}}, "efter lov", Above, {10, 9.38}, 
   LeaderSize -> {20, 90 °, 4}, CalloutStyle -> Red]}
 , Filling -> {3 -> {4}}
 , PlotStyle -> {
   Directive[Black, Thick]
   , Directive[Red, Thick]
   , Directive[Gray, Tiny]
   , Directive[Gray, Small]
   }
 , GridLines -> Automatic
 , Frame -> True
 , PlotMarkers -> {None, {Graphics[Disk[]], .02}, None, None}
 , ImageSize -> 800
 , PlotLabel -> Style["GFI-indikator elever läsåret 22/23", Black, 20]
 , LabelStyle -> Directive[Bold, Black, 12]
 , DataRange -> {0, Length[data] - 1}
 , PlotRange -> {3, 10}
 ]

enter image description here

$\endgroup$
7
  • $\begingroup$ Many thanks for this answer :) $\endgroup$
    – runner
    Commented Dec 5, 2022 at 14:19
  • $\begingroup$ What is the easiest way if I want to start numbering from e.g week 34 instead of from 0? $\endgroup$
    – runner
    Commented Dec 5, 2022 at 14:50
  • $\begingroup$ @runner You can change DataRange and add 34 as well to the Callout 's x-position manually. $\endgroup$
    – Syed
    Commented Dec 5, 2022 at 15:32
  • $\begingroup$ Next question :). How do I account for a new year? 34-52 is ok but what happens when I want to add week 1 after week 52? $\endgroup$
    – runner
    Commented Dec 5, 2022 at 18:12
  • 1
    $\begingroup$ @runner you can accept the solution if it has answered the OP by clicking the checkmark next to it. $\endgroup$
    – Syed
    Commented Dec 6, 2022 at 2:04

Your Answer

By clicking “Post Your Answer”, you agree to our terms of service and acknowledge you have read our privacy policy.

Not the answer you're looking for? Browse other questions tagged or ask your own question.