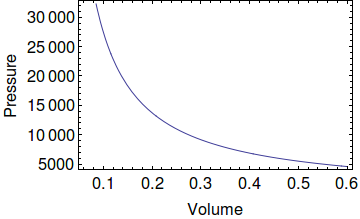
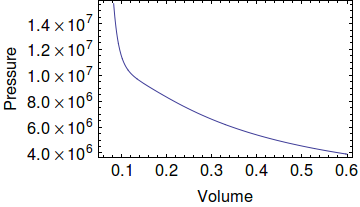
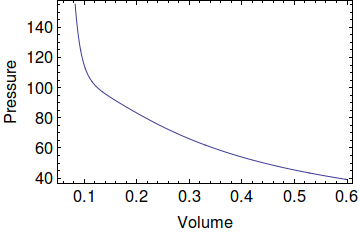
maybe I'm completely newbie but I can't understand the behavior of units and the command plot.
I'm doing some easy plotting of the state equation for gasses:
R =  Quantity[0.0831, ("Bars" "Liters")/("Kelvins" "Moles")];
a =  Quantity[3.658, ("Liters")^2]* Quantity[1, ("Bars")/("Moles")^2]
b = Quantity[0.0429, ("Liters")/("Moles")]
PVW[V_, T_, N_] := ((N*R*T)/(V - N*b)) - (+a*(N^2/V^2));
I then test that units are ok:
test = PVW[Quantity[0.6, "Liters"], Quantity[270, "Kelvins"], Quantity[1, "Moles"]];
UnitSimplify[test]
And I get my pressure back :
Quantity[30.1135, "Bars"]
Now I want my plot so I do :
Plot[PVW[V, Quantity[330, "Kelvins"], Quantity[1, "Moles"] ], {V,
Quantity[0.06, "Liters"] , Quantity[0.6, "Liters"]},
Frame -> True,
GridLines -> None,
LabelStyle -> {FontFamily -> "Helvetica", FontSize -> 15},
FrameLabel -> {"Volume", "Pressure"}]
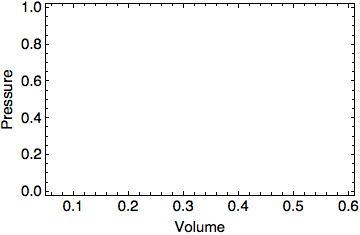
If I evaluate that I get no errors, no nothing but a empty plot:

What is going on?


{V,Quantity[0.06, "Liters"], Quantity[0.6, "Liters"]}, but this doesn't improve things greatly. Unfortunately, I'm completely unfamiliar withQuantity[]. $\endgroup${V,Quantity[0.06, "Liters"], Quantity[0.6, "Liters"]}as your plot limits, and you probably also don't want the curly braces aroundPVWcall. $\endgroup$