0
$\begingroup$

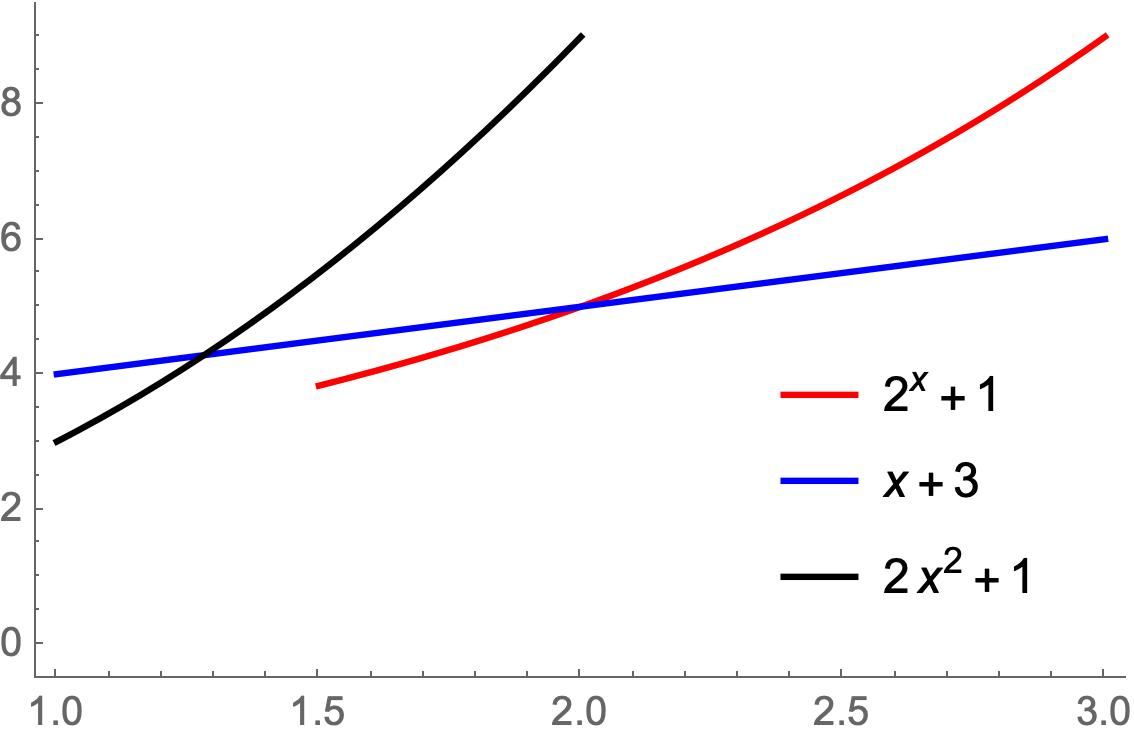
I am plotting three functions using the following code:

Show[Plot[{2^x + 1}, {x, 3/2, 3}, PlotStyle -> Red], Plot[{x + 3}, {x, 1, 3}, PlotStyle -> Blue], Plot[{2 x^2 + 1}, {x, 1, 2}, PlotStyle -> Black], PlotRange -> All, AxesOrigin -> {1, 0}]

In the generated plot, the tick labels are absent at the chosen AxesOrigin point (1,0). How can Mathematica be made to label the origin (1,0)?

$\endgroup$
8
  • $\begingroup$ Add Epilog -> {PointSize -> Large, Red, Point@{1, 0}} $\endgroup$
    – cvgmt
    Commented Nov 26, 2022 at 4:22
  • $\begingroup$ @cvgmt Sorry, but your code does not show the tick label of the origin. I want to let Mathematica show the tick of the origin (1, 0). $\endgroup$
    – Ya He
    Commented Nov 26, 2022 at 4:36
  • $\begingroup$ Alternatively, use Frame instead of Axes. Example: mathematica.stackexchange.com/a/190492/1871 $\endgroup$
    – xzczd
    Commented Nov 26, 2022 at 4:42
  • $\begingroup$ @xzczd Thanks. The answer in this link (mathematica.stackexchange.com/a/190492/1871) seems not correct. Mathematica reports error when I run the codes in the answer. $\endgroup$
    – Ya He
    Commented Nov 26, 2022 at 5:26
  • $\begingroup$ There's a compatibility issue: mathematica.stackexchange.com/a/269044/1871 Alternatively, if you don't need to customize the ticks, simply remove the FrameTicks option. $\endgroup$
    – xzczd
    Commented Nov 26, 2022 at 5:28

2 Answers 2

1
$\begingroup$

Mathematica's default is not to put a label where axes cross as (I think) it would become too crowded.

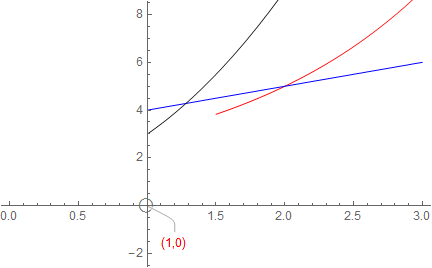
A possibility could be to use a Callout on a separate plot and adjust the label and styling as needed. There are plenty of options available for Callout styling that will not be discussed here.

Show[
 Plot[{2^x + 1}, {x, 3/2, 3}, PlotStyle -> Red]
 , Plot[{x + 3}, {x, 1, 3}, PlotStyle -> Blue]
 , Plot[{2 x^2 + 1}, {x, 1, 2}, PlotStyle -> Black]
 , ListPlot[{Callout[{1, 0}, Style["(1,0)", Red]
    , {1.2, -0.6}, {1, 0}]}
  , PlotMarkers -> {Style["\[EmptyCircle]", 18, Gray]}]
 , PlotRange -> {{0, 3}, {-2, 8}}, AxesOrigin -> {1, 0}
 ]

enter image description here

$\endgroup$
3
  • $\begingroup$ Thanks, but this proposal is a bit tangential to the question I asked. $\endgroup$
    – Ya He
    Commented Nov 26, 2022 at 5:51
  • $\begingroup$ You can show (using a <hand-drawn> image) where and what you are looking for exactly. I see many responses; each interpreting your question a bit differently. $\endgroup$
    – Syed
    Commented Nov 26, 2022 at 6:01
  • $\begingroup$ It seems I have find the solution to this question. Use PlotRangePadding -> 0 and Ticks to explicitly specify the tick lables. $\endgroup$
    – Ya He
    Commented Nov 26, 2022 at 23:24
1
$\begingroup$

With a single Plot

Plot[
 Evaluate[
  ConditionalExpression @@@
   {{2^x + 1, 3/2 < x < 3},
    {x + 3, 1 < x < 3},
    {2 x^2 + 1, 1 < x < 2}}],
 {x, 1, 3},
 AxesOrigin -> {1, 0},
 PlotStyle -> {Red, Blue, Black},
 PlotRange -> All,
 Frame -> {{True, False}, {True, False}},
 PlotLegends ->
  Placed[
   {2^x + 1, x + 3, 2 x^2 + 1},
   {0.8, 0.28}]]

enter image description here

$\endgroup$
1
  • $\begingroup$ Thanks, but I prefer that the two axes can cross at the origin (1, 0). $\endgroup$
    – Ya He
    Commented Nov 26, 2022 at 5:48

Not the answer you're looking for? Browse other questions tagged or ask your own question.