2
$\begingroup$

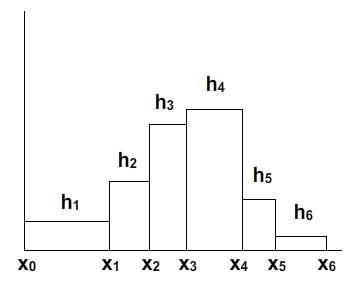
I got the data of each bin by measurements like {start, end, height} and I want something like this picture:

enter image description here

I have no other data for the Histogram[], just what you can see on the linked picture. So any ideas how to do this in Mathematica (version 9)?

(The whole thing is for fitting a distibution curve on it.)

$\endgroup$

3 Answers 3

2
$\begingroup$

Generate the test data:

points = 10;
SeedRandom[123];
xi = Sort[Table[n + RandomReal[{-.2, 1.5}], {n, points + 1}]]
yi = RandomReal[{1, 5}, points]
data = Table[{xi[[i]], xi[[i + 1]], yi[[i]]}, {i, Length[yi]}]

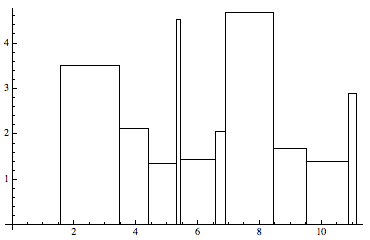
This creates the data in the format $\{start,end,height\}$. Draw the plot:

ListPlot[data[[All, {2, 3}]], PlotStyle -> None, 
 Prolog -> {Opacity[0], EdgeForm[Black], 
   Rectangle[{#[[1]], 0}, {#[[2]], #[[3]]}] & /@ data}, 
 AxesOrigin -> {0, 0}]

Bar plot

$\endgroup$
1
  • $\begingroup$ Graphics[{Opacity[0], EdgeForm[Black], Rectangle[{#[[1]], 0}, {#[[2]], #[[3]]}] & /@ data}, Frame -> True] $\endgroup$ Commented Aug 26, 2019 at 0:41
2
$\begingroup$

First I'll generate some data in {start,end,height} format. This data is drawn from a standard normal distribution.

data = Partition[Flatten[Transpose[{Thread[{Most[#[[1]]], Rest[#[[1]]]}], #[[2]]}]], 3] &
              [HistogramList[RandomReal[NormalDistribution[], 100], Automatic, "PDF"]]

Now you could try using a combination of explicit binning and a height function.

hfun[bins_, counts_] := counts
x = Union[Flatten[data[[All, 1 ;; 2]]]];
h = data[[All, -1]];
Histogram[x, {x}, hfun[#, h] &]
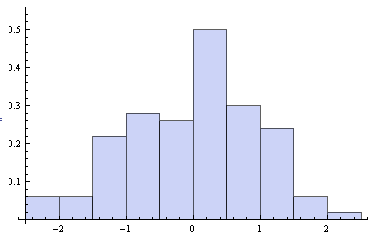
enter image description here

Suppose you want to compare it to the underlying distribution.

Show[Histogram[x, {x}, hfun[#, h] &], 
 Plot[PDF[NormalDistribution[], t], {t, -3, 3}], PlotRange -> All]
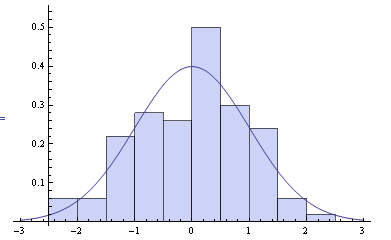
enter image description here

Edit:

In this particular case I assume normalized heights because I generated them with HistogramList and the setting "PDF". If this is not the case you may need to normalize them yourself. This can be accomplished by replacing h with hnorm in Histogram where hnorm is given by

hnorm = h/Differences[x].h
$\endgroup$
0
1
$\begingroup$

Using the data generated in @shrx's answer:

bins = DeleteDuplicates@Flatten@data[[All, ;; 2]];
heights = data[[All, 3]];
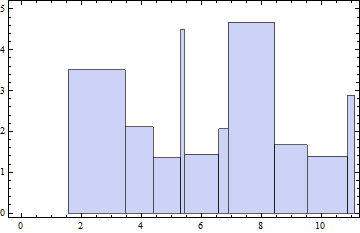
Histogram[{0}, {bins}, ( heights &), Axes -> False,  Frame -> True,
 PlotRangePadding -> {{2, Automatic}, Automatic}]

enter image description here

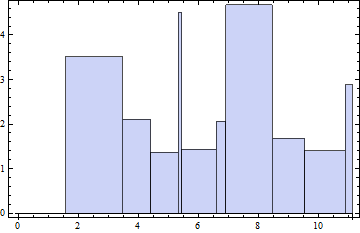
You can also use RectangleChart after some processing of data:

RectangleChart[Prepend[{Subtract[#2, #], #3} & @@@ data, { data[[1, 1]], 0}], 
 BarSpacing -> 0, Frame -> True]

enter image description here

$\endgroup$
1

Your Answer

By clicking “Post Your Answer”, you agree to our terms of service and acknowledge you have read our privacy policy.

Not the answer you're looking for? Browse other questions tagged or ask your own question.