2
$\begingroup$

I have the following code:

adata = {{2.`, 2.977288135593221`}, {3.`, 5.057966101694916`}, {4.`, 9.12474576271186`}, {4.954196310386875`, 18.`}, {5.977279923499916`, 31.`}, {6.965784284662088`, 51.494915254237284`}, {7.965784284662086`, 76.4315254237288`}, {8.965784284662087`, 95.`}}

bdata = {{2.`, 2.`}, {3.`, 3.`}, {4.`, 8.`}, {4.954196310386875`, Around[18., 4.]}, {5.977279923499916`, Around[31., 8.]}, {6.965784284662088`, Around[53., 3.]}, {7.965784284662086`, Around[75., 4.]}, {8.965784284662087`, Around[88., 2.]}}

Labeled[Show[{ListLinePlot[{adata, bdata}, IntervalMarkers -> "Fences", PlotMarkers -> {Graphics[{Disk[], {Thick, Circle[]}}], 0.04}, Ticks -> {{{2, 4}, {3, 8}, {4, 16}, {5, 31}, {6, 63}, {7, 125}, {8, 250}, {9, 500}}, {{20, "20%"}, {40, "40%"}, {60, "60%"}, {80, "80%"}, {100, "100%"}}}, LabelStyle -> {22, GrayLevel[0]}, PlotStyle -> {{RGBColor[0.368417, 0.506779, 0.709798], Thick}, {RGBColor[0.922526, 0.385626, 0.209179], Thick}}, BaseStyle -> {FontFamily -> "Latin Modern Math"}, PlotLegends -> {Style["Simulation", FontFamily -> "Latin Modern Math"], Style["Experiment", FontFamily -> "Latin Modern Math"]}]}, ImageSize -> Large], {Rotate[Style["% Cells", FontFamily -> "Latin Modern Math"], 90 Degree], Style["MOI", FontFamily -> "Latin Modern Math"]}, {Left, Bottom}, LabelStyle -> {22, GrayLevel[0]}]

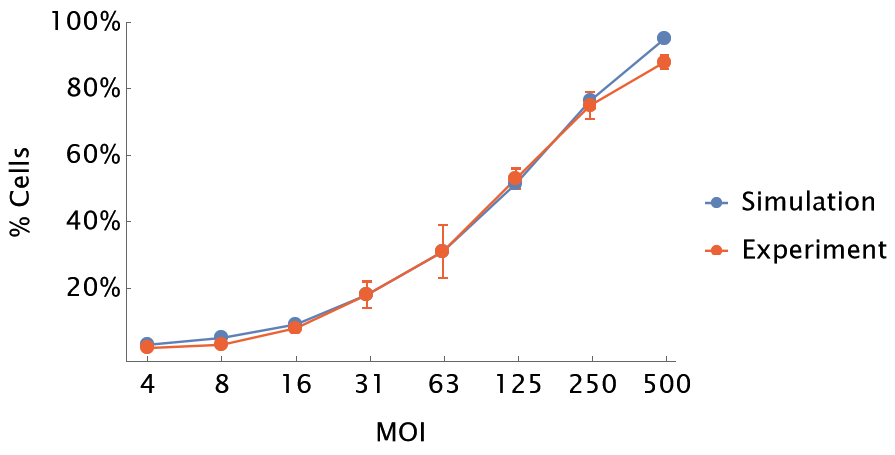
which produces:

enter image description here

How can I position the x-axis label "MOI" to be exactly at the center of the plot area? Currently it appears skewed a bit to the right because it is centered with respect to the entire graphic.

$\endgroup$

3 Answers 3

5
$\begingroup$

This:

Column[{
  Labeled[
   ListLinePlot[{adata, bdata}, IntervalMarkers -> "Fences", 
    PlotMarkers -> {Graphics[{Disk[], {Thick, Circle[]}}], 0.04}, 
    Ticks -> {{{2, 4}, {3, 8}, {4, 16}, {5, 31}, {6, 63}, {7, 
        125}, {8, 250}, {9, 500}}, {{20, "20%"}, {40, "40%"}, {60, 
        "60%"}, {80, "80%"}, {100, "100%"}}}, 
    LabelStyle -> {22, GrayLevel[0]}, 
    PlotStyle -> {{RGBColor[0.368417, 0.506779, 0.709798], 
       Thick}, {RGBColor[0.922526, 0.385626, 0.209179], Thick}}, 
    BaseStyle -> {FontFamily -> "Latin Modern Math"}, 
    PlotLegends -> {Style["Simulation", 
       FontFamily -> "Latin Modern Math"], 
      Style["Experiment", FontFamily -> "Latin Modern Math"]}, 
    ImageSize -> Large], {Rotate[
     Style["% Cells", FontFamily -> "Latin Modern Math"], 90 Degree], 
    Style["", 6]}, {Left, Bottom}, LabelStyle -> {22, GrayLevel[0]}],
  Row[{Spacer[300], 
    Graphics[{Text[
       Style["MOI", 20, FontFamily -> "Latin Modern Math"]]}]}]
  }, Spacings -> -3.5]

does what you want if I understood you right. Have a look:

enter image description here

Play a bit with the argument of Spacer[] to adjust the position of "MOI."

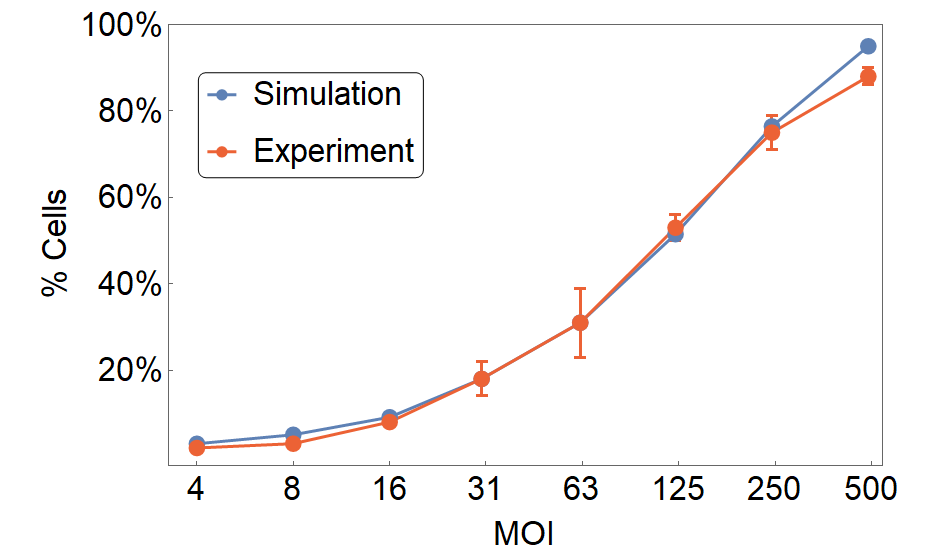
The displacement of the position of the bottom label is because of the use of the PlotLegend. That is, the position of "MOI" is in the center if you take the size of the plot together with the size of the legend into account.

I would do such a plot differently: see below

ListLinePlot[{adata, bdata}, IntervalMarkers -> "Fences", 
 Frame -> True, 
 PlotMarkers -> {Graphics[{Disk[], {Thick, Circle[]}}], 0.04}, 
 LabelStyle -> {22, GrayLevel[0]}, 
 PlotStyle -> {{RGBColor[0.368417, 0.506779, 0.709798], 
    Thick}, {RGBColor[0.922526, 0.385626, 0.209179], Thick}}, 
 BaseStyle -> {FontFamily -> "Latin Modern Math"},
 PlotLegends -> 
  Placed[PointLegend[{Style["Simulation", 
      FontFamily -> "Latin Modern Math"], 
     Style["Experiment", FontFamily -> "Latin Modern Math"]}, 
    LegendFunction -> "Frame"], Scaled[{0.2, 0.77}]], 
 ImageSize -> Large,
 FrameLabel -> {Style["MOI", FontFamily -> "Latin Modern Math"], 
   Style["% Cells", FontFamily -> "Latin Modern Math"]},
 FrameTicks -> {{{{20, "20%"}, {40, "40%"}, {60, "60%"}, {80, 
      "80%"}, {100, "100%"}}, 
    None}, {{{2, 4}, {3, 8}, {4, 16}, {5, 31}, {6, 63}, {7, 125}, {8, 
      250}, {9, 500}}, None}}
 ]

which yields the following plot:

enter image description here

Have fun!

$\endgroup$
1
  • $\begingroup$ I use 12.0. Maybe, this is due to their differences. Check PlotLegends, Placed and LegendFunction in your version to see if there is something new in them. $\endgroup$ Commented Oct 30, 2022 at 15:12
3
$\begingroup$

Add to your ticks:

{5.5, Style["\nMOI", FontFamily -> "Latin Modern Math"], {0, 0}}

and remove the label from the other location.

enter image description here

$\endgroup$
2
$\begingroup$

You could use Frame

Mathematica graphics

code

leftticks = {{20, "20%"}, {40, "40%"}, {60, "60%"}, {80, "80%"}, {100,"100%"}};
bottomticks = { {2, 4}, {3, 8}, {4, 16}, {5, 31}, {6, 63}, {7, 125}, {8, 250}, {9, 500}};

leftLabel = Style["% Cells", FontFamily -> "Latin Modern Math"];    
bottomLabel = Style["MOI", FontFamily -> "Latin Modern Math"];

ListLinePlot[{adata, bdata}, IntervalMarkers -> "Fences",
 PlotMarkers -> {Graphics[{Disk[], {Thick, Circle[]}}], 0.04}, 
 LabelStyle -> {22, GrayLevel[0]}, 
 PlotStyle -> {{RGBColor[0.368417, 0.506779, 0.709798], 
    Thick}, {RGBColor[0.922526, 0.385626, 0.209179], Thick}}, 
 BaseStyle -> {FontFamily -> "Latin Modern Math"}, 
 PlotLegends -> {Style["Simulation", 
    FontFamily -> "Latin Modern Math"], 
   Style["Experiment", FontFamily -> "Latin Modern Math"]},
 ImageSize -> Large,
 FrameTicks -> {{leftticks, None} , {bottomticks, None}},
 FrameLabel -> {{leftLabel, None}, {bottomLabel, None}},
 Frame -> {{True, False}, {True, False}}
 ]
$\endgroup$
0

Your Answer

By clicking “Post Your Answer”, you agree to our terms of service and acknowledge you have read our privacy policy.