I have the following code:
adata = {{2.`, 2.977288135593221`}, {3.`, 5.057966101694916`}, {4.`, 9.12474576271186`}, {4.954196310386875`, 18.`}, {5.977279923499916`, 31.`}, {6.965784284662088`, 51.494915254237284`}, {7.965784284662086`, 76.4315254237288`}, {8.965784284662087`, 95.`}}

bdata = {{2.`, 2.`}, {3.`, 3.`}, {4.`, 8.`}, {4.954196310386875`, Around[18., 4.]}, {5.977279923499916`, Around[31., 8.]}, {6.965784284662088`, Around[53., 3.]}, {7.965784284662086`, Around[75., 4.]}, {8.965784284662087`, Around[88., 2.]}}

Labeled[Show[{ListLinePlot[{adata, bdata}, IntervalMarkers -> "Fences", PlotMarkers -> {Graphics[{Disk[], {Thick, Circle[]}}], 0.04}, Ticks -> {{{2, 4}, {3, 8}, {4, 16}, {5, 31}, {6, 63}, {7, 125}, {8, 250}, {9, 500}}, {{20, "20%"}, {40, "40%"}, {60, "60%"}, {80, "80%"}, {100, "100%"}}}, LabelStyle -> {22, GrayLevel[0]}, PlotStyle -> {{RGBColor[0.368417, 0.506779, 0.709798], Thick}, {RGBColor[0.922526, 0.385626, 0.209179], Thick}}, BaseStyle -> {FontFamily -> "Latin Modern Math"}, PlotLegends -> {Style["Simulation", FontFamily -> "Latin Modern Math"], Style["Experiment", FontFamily -> "Latin Modern Math"]}]}, ImageSize -> Large], {Rotate[Style["% Cells", FontFamily -> "Latin Modern Math"], 90 Degree], Style["MOI", FontFamily -> "Latin Modern Math"]}, {Left, Bottom}, LabelStyle -> {22, GrayLevel[0]}]
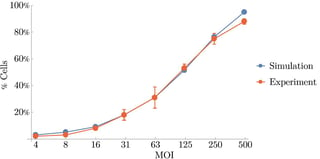
which produces:
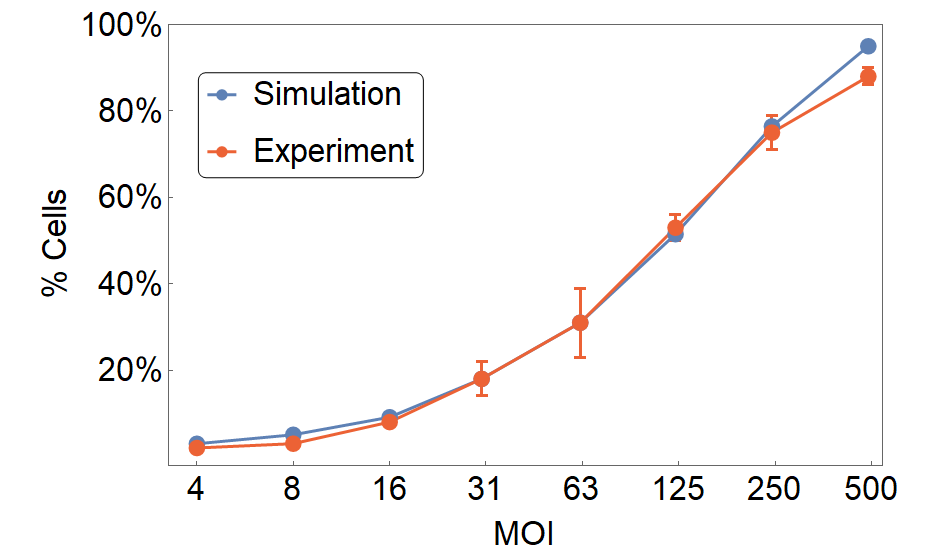
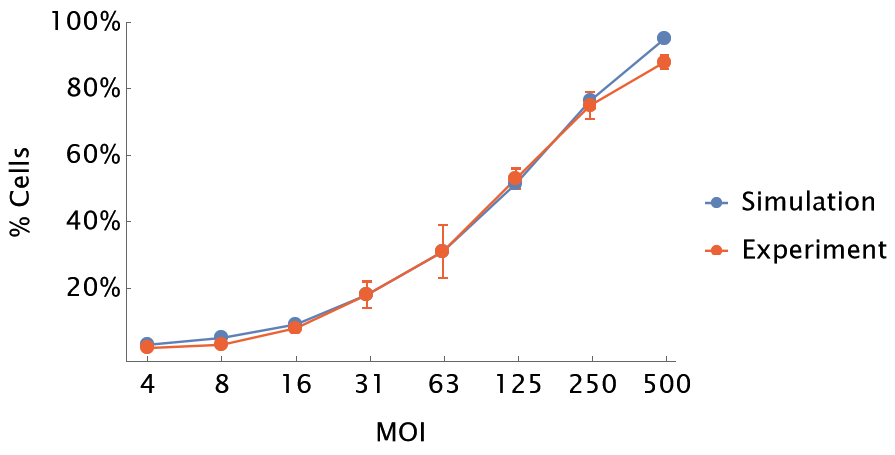
How can I position the x-axis label "MOI" to be exactly at the center of the plot area? Currently it appears skewed a bit to the right because it is centered with respect to the entire graphic.


