0
$\begingroup$

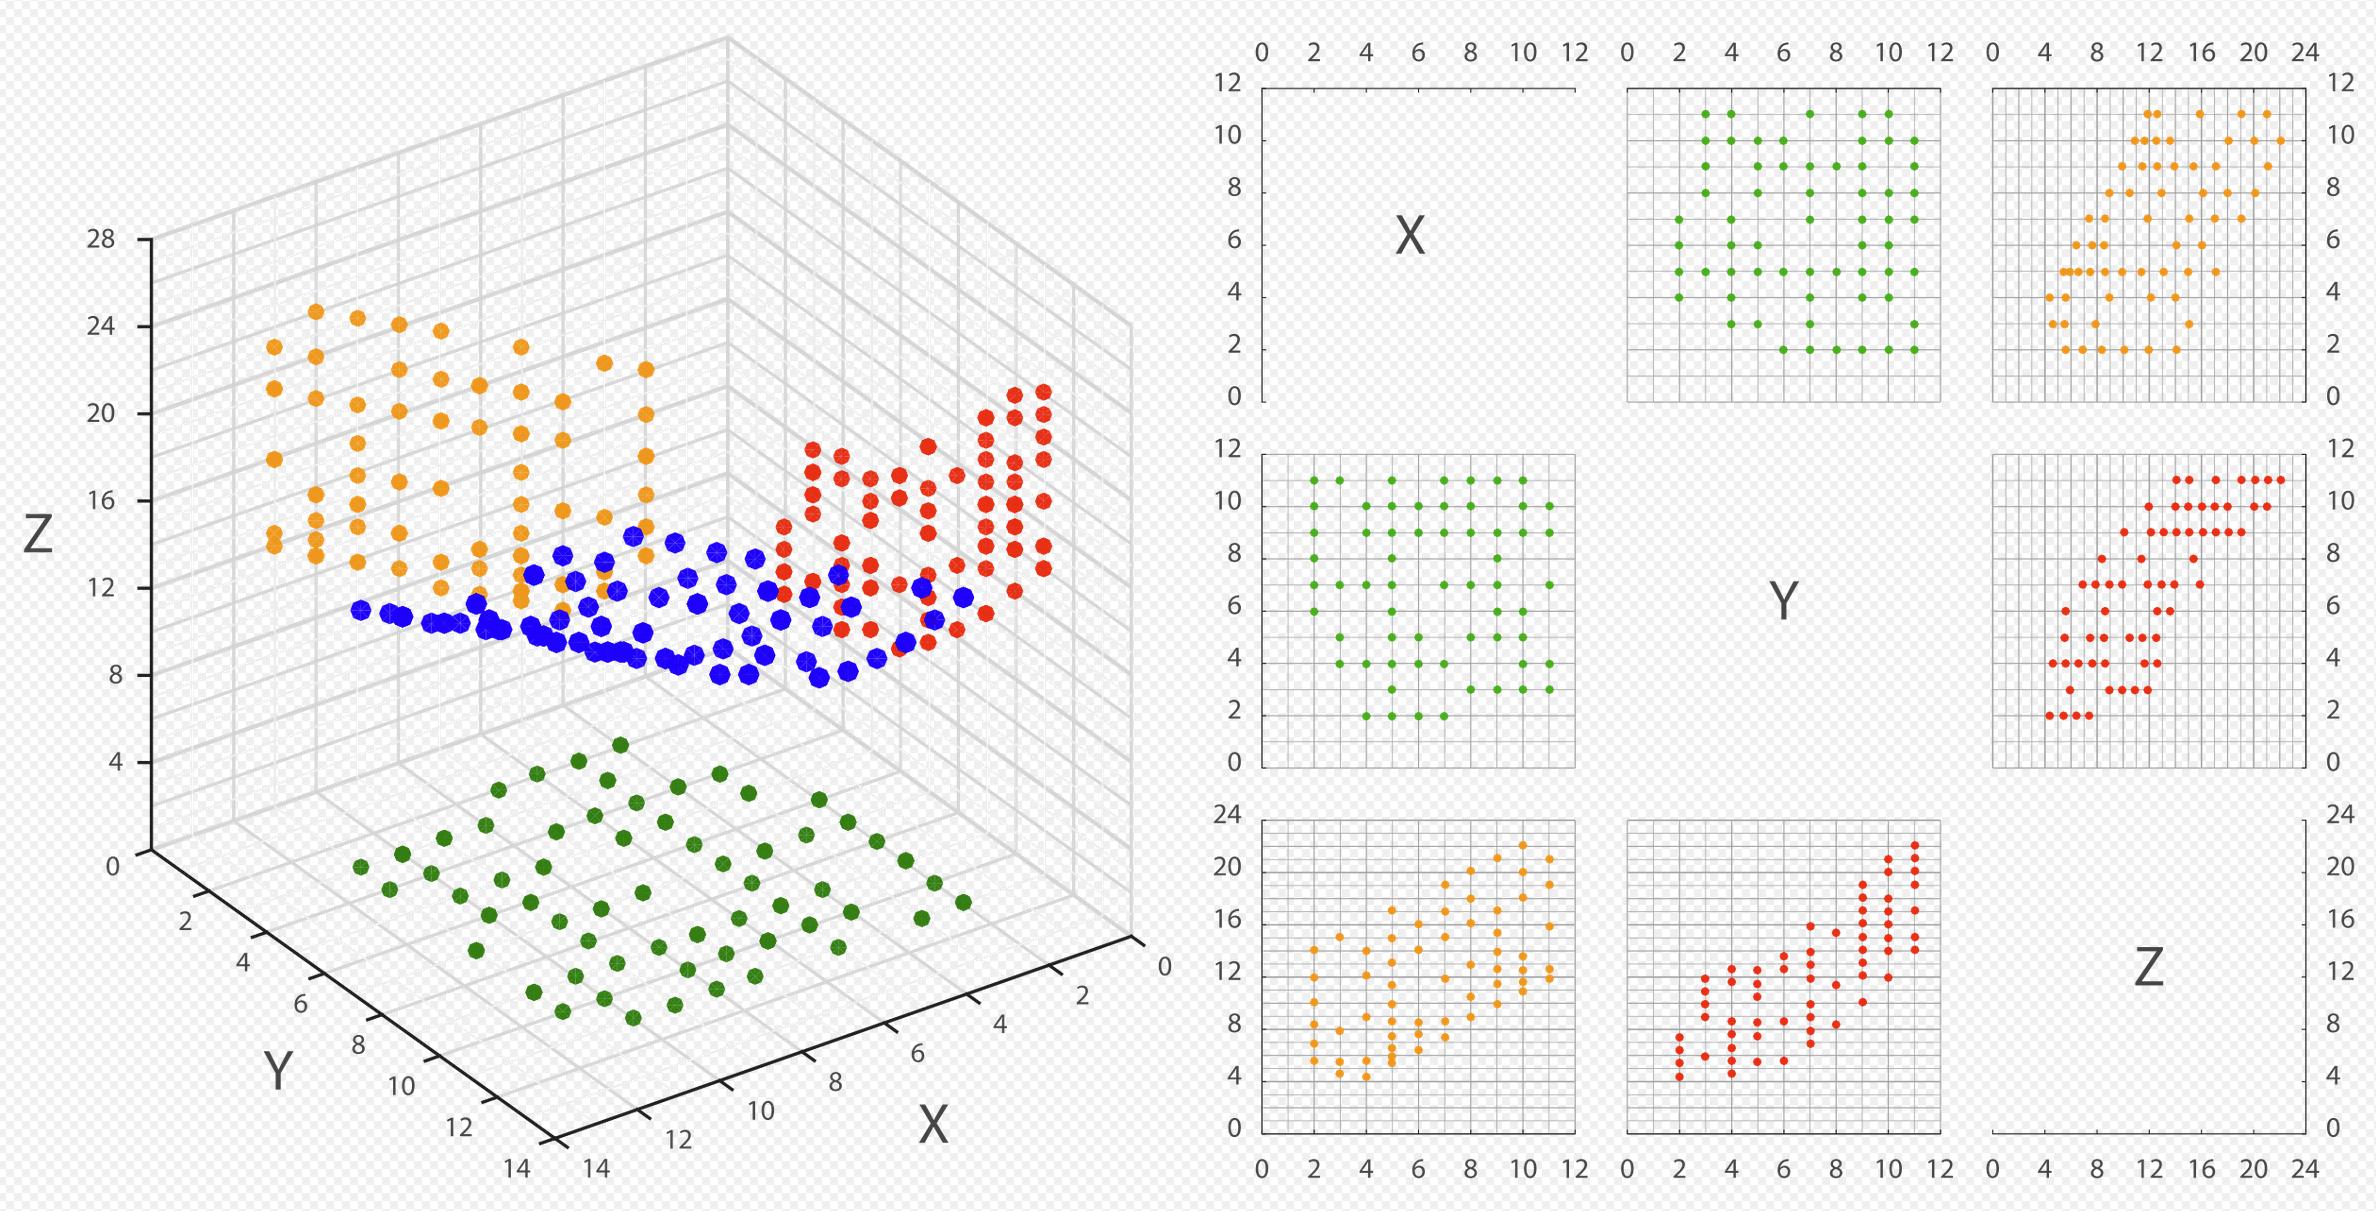
I need to plot a similar graph of a function [Scatter plot matrices]:

enter image description here

For:

$f(x,y,z,t) \rightarrow x^2 + y^3 + z^2 + t^2 ≤ 1,x + y - z = t^2$

But, I work in older version of Mathematica - 12.0

My considerations:

  1. build a dataset that satisfy a given inequalities with help FindInstance
  2. distribute them in pairs
  3. place charts in the table using the Show command or equivalent

Issue: The resulting plots are discrete and the FindInstance command is slow with a large number of points. Are there easier ways to get continuous scatter plot matrix?

FindInstance[x^2 + y^3 + z^2 + t^2 <= 1 && x + y - z == t^2, {x, y, z, t}, Reals,5] // N
$\endgroup$
3
  • 3
    $\begingroup$ See mathematica.stackexchange.com/questions/69713/…. $\endgroup$
    – JimB
    Commented Oct 16, 2022 at 6:04
  • $\begingroup$ @JimB thank you very much! I will try to study the material $\endgroup$
    – ayr
    Commented Oct 16, 2022 at 6:44
  • 1
    $\begingroup$ Instead of FindInstances you could use the following faster code: sol=Solve[{y==y0,t==t0,x^2+y^3+z^2+t^2==1-a0,x+y-z==t^2},{x,y,z,t}]; randomSolution:=Block[{a0=RandomReal[{0,1}],y0=RandomReal[{-1,1}],t0=RandomReal[{-1,1}]}, sol]; Flatten[Select[Table[randomSolution,100],FreeQ[#,Complex]&],1] $\endgroup$
    – user293787
    Commented Oct 16, 2022 at 8:02

1 Answer 1

2
$\begingroup$

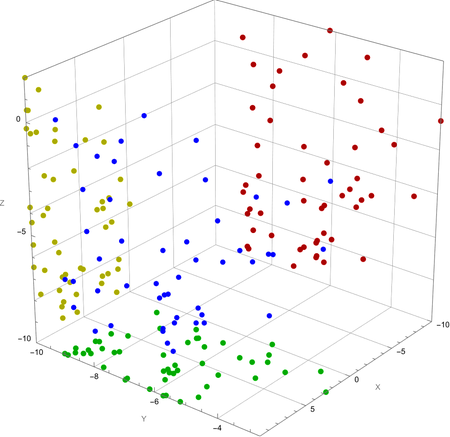
Here we try to provide the 3D version of scatter plot.

Clear[cond, reg, pts];
SeedRandom[3];
cond = Resolve[
   Exists[t, x^2 + y^3 + z^2 + t^2 <= 1 && x + y - z == t^2], Reals];
reg = ImplicitRegion[cond, {x, y, z}];
pts = RandomPoint[
   RegionIntersection[reg, Cuboid[-10 {1, 1, 1}, 10 {1, 1, 1}]], 50];
ListPointPlot3D[{pts, 
  TranslationTransform[{0, 0, -10}]@ScalingTransform[{1, 1, 0}]@pts, 
  TranslationTransform[{0, -10, 0}]@ScalingTransform[{1, 0, 1}]@pts, 
  TranslationTransform[{-10, 0, 0}]@ScalingTransform[{0, 1, 1}]@pts}, 
 ViewPoint -> {5, 4, 3}, BoxRatios -> 1, AxesLabel -> {"X", "Y", "Z"},
  PlotStyle -> {Directive[AbsolutePointSize[Large], Blue], 
   Darker@Green, Darker@Yellow, Darker@Red}, 
 AxesEdge -> {{1, -1}, {1, -1}, {1, -1}}, 
 Boxed -> {Front, Bottom, Left}, 
 FaceGrids -> {{-1, 0, 0}, {0, -1, 0}, {0, 0, -1}}, 
 PlotRangePadding -> None]

enter image description here

$\endgroup$

Your Answer

By clicking “Post Your Answer”, you agree to our terms of service and acknowledge you have read our privacy policy.

Not the answer you're looking for? Browse other questions tagged or ask your own question.