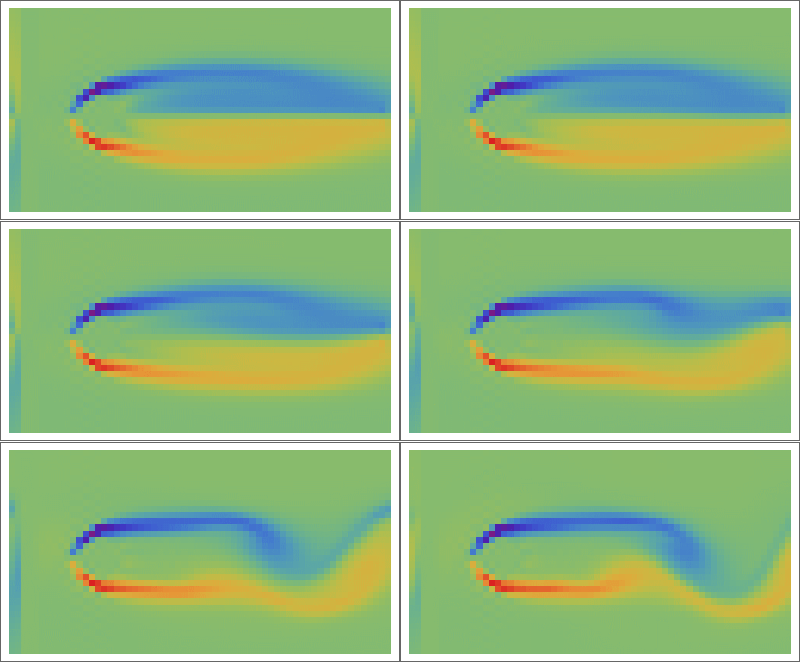
About 9 years ago, I came across this interesting website, and found the following paragraph with a broken Mathematica code sample:
When fluid passes an object, it can leave a trail of vortices called a Von Kármán Vortex Street. This animation shows the vorticity where blue is clockwise and red is counter-clockwise. This simulation assumes unsteady, incompressible, viscid, laminar flow. For solenoidal flows, mass conservation can be achieved by taking the Fast Fourier Transform (FFT) of the velocity and then removing the radial component of the wave number vectors. The code was adapted from Jos Stam’s C Source Code and paper which is patented by Alias.
(* Note: Something is wrong with this Mathematica code.
   Please tell me if you find out what it is. runtime: 14 seconds *)

n = 64; dt = 0.3; mu = 0.001; v = Table[{0, 0}, {n}, {n}];

Do[
   Do[If[i < 5, v[[i, j]] = {0.1, 0}];
      If[(i - n/4)^2 + (j -n/2)^2 < 4^2, v[[i, j]] = {0, 0}],
      {i, 1, n}, {j, 1, n}];

   ui = ListInterpolation[v[[All, All, 1]]];
   vi = ListInterpolation[v[[All, All, 2]]];
   v = Table[{i2, j2} = {i, j} - n dt v[[i, j]];
             {ui[i2, j2], vi[i2, j2]}, {i, 1, n}, {j, 1, n}];

   v = Transpose[Map[Fourier[v[[All, All, #]]] &, {1, 2}], {3, 1, 2}];
   v = Table[x = Mod[i + n/2, n] - n/2;
             y = Mod[j + n/2, n] - n/2;
             k = x^2 + y^2;
             Exp[-k dt mu] If[k > 0, (v[[i, j]].{-y, x}/k){-y, x}, v[[i, j]]],
             {i, 1, n}, {j, 1, n}];
   v = Transpose[Map[Re[InverseFourier[v[[All, All, #]]]] &,{1,2}], {3, 1, 2}];

   ListDensityPlot[Table[((v[[i + 1, j, 2]] - v[[i - 1, j, 2]]) -
                          (v[[i, j + 1, 1]] - v[[i, j - 1, 1]]))/2,
                         {j, 2, n - 1}, {i, 2, n - 1}],
                   Mesh -> False,Frame->False,ColorFunction -> (Hue[2#/3] &)],
  {t, 1, 25}];
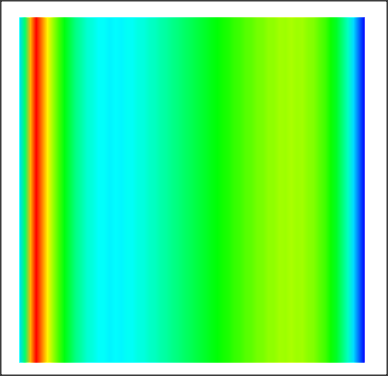
Since then, every a year or two, I would be seized by a whim and try to fix the broken code, and fail then. And yes, I just failed one more time :D . So I think it may be the time to cry out loud: Why doesn't this sample work? How can it be fixed? By "doesn't work", I mean the obtained simulation result isn't even close to the GIF shown above. As an example, the following is the ListDensityPlot for t == 25:
I know there exist multiple ways to simulate vortex street, but in this question I'm particularly interested in fixing this code sample.
Several possible issues I can spot:
The
ListDensityPlotis inside aDoloop, this is probably because the code is written in a early version of Mathematica, and*Plotis automaticallyPrinted at that time, as discussed in this post. This isn't a big problem, we just need to e.g. useTableinstead of the outermostDo.uiandvishould be periodic, this can be easily fixed with e.g.{ui, vi} = Module[{ui = #}, ui[[-1]] = ui[[1]]; ui[[All, -1]] = ui[[All, 1]]; ListInterpolation[ui, InterpolationOrder -> 1, PeriodicInterpolation -> True]] & /@ Transpose[v, {2, 3, 1}]but fixing this won't fix the simulation.
The original C code normalizes the velocity by dividing it by
n^2as the last step,but adding this step to Mathematica code doesn't fix the code.this is not needed for Mathematica code, because according to the document of fftw, the convention of fftw is amount toFourierParameters -> {-1, 1}. The default setting ofFourierisFourierParameters -> {0, 1}i.e. the normalization is already done.The grid used for simulation seems to be too coarse, but adjusting various parameters in the code doesn't seem to help. (I admit my adjustion is somewhat blind, though. )
For your convenience, the following is the code sample aiming at fixing the mentioned issues above. Of course, it still doesn't work:
n = 128; dt = 0.3; mu = 0.001; nt = 50;
v = Table[{0., 0.}, {n}, {n}];
separate = Transpose[#, {2, 3, 1}] &;
combine = Transpose[#, {3, 1, 2}] &;

vlst = Table[Do[If[i < 1 + n/16, v[[i, j]] = {0.1, 0.}];
                If[(i - n/4)^2 + (j - n/2)^2 < (n/16)^2,
                   v[[i, j]] = {0., 0.}], {i, n}, {j, n}];
    {ui, vi} =
     Module[{umat = #}, umat[[-1]] = umat[[1]];
                        umat[[All, -1]] = umat[[All, 1]];
                        ListInterpolation[umat, InterpolationOrder -> 1,
                        PeriodicInterpolation -> True]] & /@ separate@v;
    v = Table[{i2, j2} = {i, j} - n dt v[[i, j]];
              {ui[i2, j2], vi[i2, j2]}, {i, n}, {j, n}];
    v = Fourier /@ separate@v // combine;
    v = Table[x = Mod[i + n/2, n] - n/2;
              y = Mod[j + n/2, n] - n/2;
              k = x^2 + y^2;
              Exp[-k dt mu] If[k > 0, (v[[i, j]] . {-y, x}/k) {-y, x},
                                      v[[i, j]]],
              {i, n}, {j, n}];
    v = InverseFourier /@ separate@v // combine // Re,
    {t, nt}]; // AbsoluteTiming
(* {24.4562, Null} *)
vortex = Compile[{{v, _Real, 3}},
                 With[{n = Length@v},
                      Table[((v[[i + 1, j, 2]] - v[[i - 1, j, 2]]) -
                             (v[[i, j + 1, 1]] - v[[i, j - 1, 1]]))/2,
                            {j, 2, n - 1}, {i, 2, n - 1}]]];
arrayplot =
  ArrayPlot[#, DataReversed -> True, ColorFunction -> "Rainbow"] &;
vortex@vlst[[-1]] // arrayplot
Update
This is a bit embrassing: there exists another simple mistake in the implementation, if it's fixed, the vortex street will be obtained with minimal parameter adjustion. In order not to waste the bounty, I'd like not to make the answer public for the moment. The bounty will be awarded to the first answerer figuring out the mistake and obtaining the vortex street (not necessarily exactly the same as the GIF above).
Update 2: Hint
Since the bounty will be expired in 23 hours but nobody has figured out the answer so far, let me give a hint: moving the cursor with mouse, the code can be fixed within 5 keystrokes.


Exp[-k dt mu]term to the velocity in frequency domain. The problem is, in principle we should get a simulation result similar to the GIF in the question, but currently the density plot of the calculated vorticity is vastly different from it. $\endgroup$