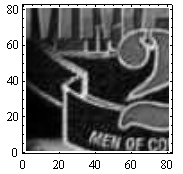
This problem is endemic to all programs that handle images/graphics and matrices. Why? Because there are two different coordinate systems in common use. Images, like graphics, use regular Cartesian coordinates. For example, the point (1,2) means one to the right and two up. The point (10, 3) means 10 to the right and 3 up. The origin is effectively in the bottom-left and the two coordinates are indices into the (column, row).
Contrast this with matrices. Here the convention is
a11 a12 a13
a21 a22 a23
a31 a32 a33
In this arrangement, the origin is effectively at the top left and the two coordinates index into the (row, column). The symptom you see (having to Reverse the ImageData) is a result of this dual-origin problem.
You can see this dual-system at work by clicking on an image. Choose "get coordinates" and the coordinate system for the image has (1,1) in the lower left. But if you choose "get indices" then the coordinate system starts in the top left. Coordinates are the image coordinates, indices index into ImageData. So for instance, ImageValue[img, {1, 1}] gives the bottom left pixel value. The documentation tries to reduce this confusion by using words like "gives the pixel value of image at position {x,y}" (for example, see the help for ImageValue) to refer to image (Cartesian) coordinates, while it uses "row," "column," and "index" when it is using matrix-indices (for example, see the help file for ImageTake).
Not quite as deep as Cartesian duality, but confusing enough for anyone using images in Mathematica or Matlab.


ImageTakeat all. If you tried to do the sameListDensityPlotwith the originalOIBWimage, you'd have toReverseitsImageDatatoo. $\endgroup$