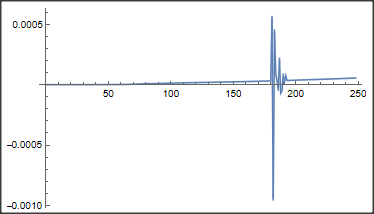
The code I use is as follows
ip = Interpolation[data, InterpolationOrder -> 3];
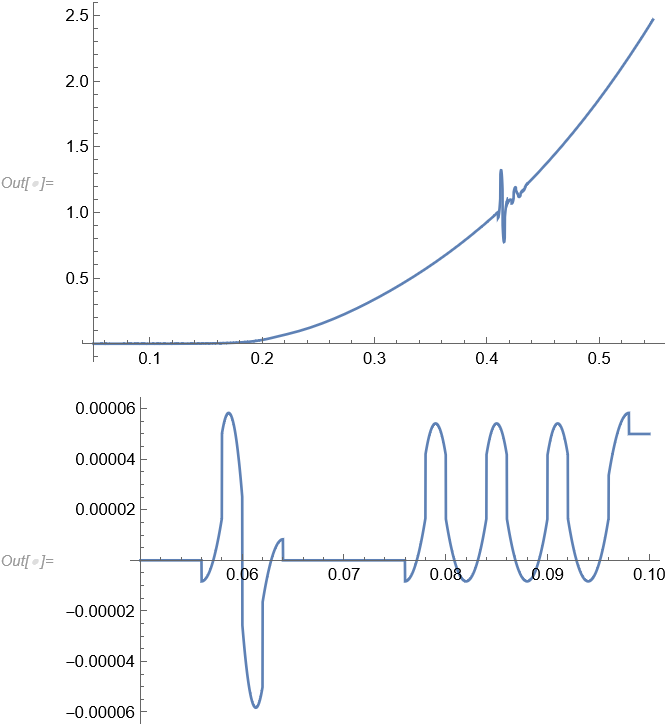
Plot[{ip[x], ip'[x], ip''[x]}, {x, 0.05, 0.5}]
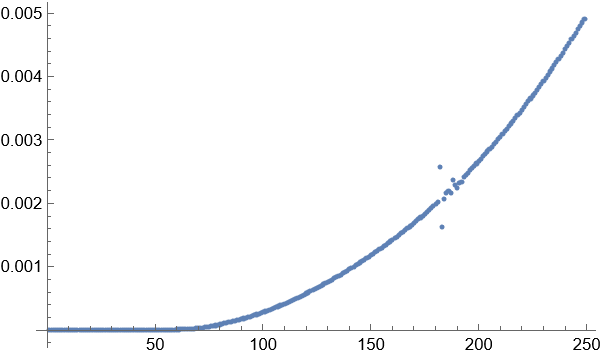
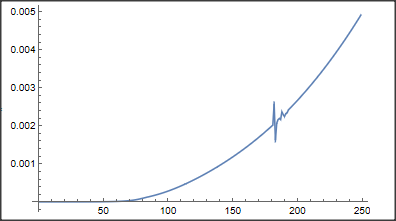
I get fluctuations for the first derivative (a little bit) and the second derivative (in a huge amount). These fluctuations should not be there as the result is known. How to get rid of these fluctuations? Any suggestion is most welcome.
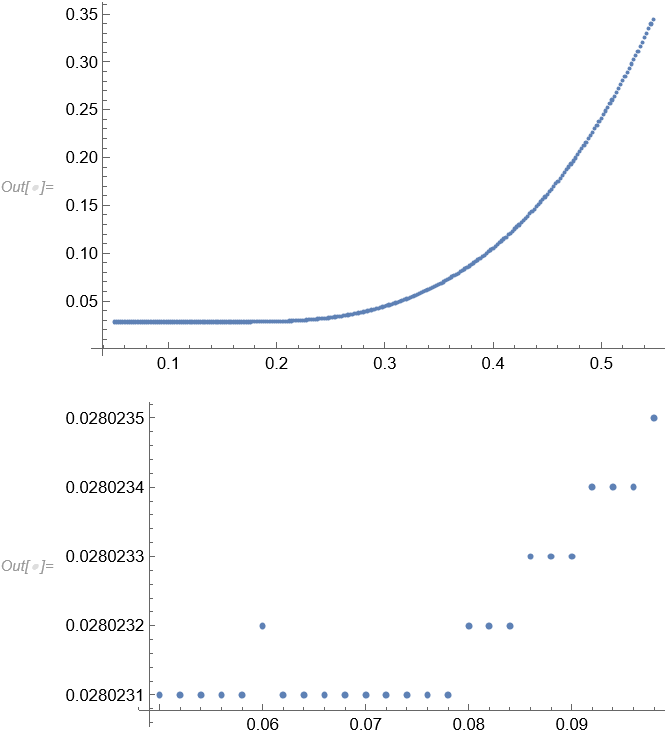
I use the following data
data={{0.05, 0.0280231}, {0.052, 0.0280231}, {0.054, 0.0280231}, {0.056,
  0.0280231}, {0.058, 0.0280231}, {0.06, 0.0280232}, {0.062,
  0.0280231}, {0.064, 0.0280231}, {0.066, 0.0280231}, {0.068,
  0.0280231}, {0.07, 0.0280231}, {0.072, 0.0280231}, {0.074,
  0.0280231}, {0.076, 0.0280231}, {0.078, 0.0280231}, {0.08,
  0.0280232}, {0.082, 0.0280232}, {0.084, 0.0280232}, {0.086,
  0.0280233}, {0.088, 0.0280233}, {0.09, 0.0280233}, {0.092,
  0.0280234}, {0.094, 0.0280234}, {0.096, 0.0280234}, {0.098,
  0.0280235}, {0.1, 0.0280236}, {0.102, 0.0280237}, {0.104,
  0.0280238}, {0.106, 0.028024}, {0.108, 0.0280241}, {0.11,
  0.0280243}, {0.112, 0.0280246}, {0.114, 0.0280248}, {0.116,
  0.0280252}, {0.118, 0.0280256}, {0.12, 0.028026}, {0.122,
  0.0280266}, {0.124, 0.0280272}, {0.126, 0.0280279}, {0.128,
  0.0280288}, {0.13, 0.0280297}, {0.132, 0.0280308}, {0.134,
  0.0280321}, {0.136, 0.0280336}, {0.138, 0.0280352}, {0.14,
  0.0280371}, {0.142, 0.0280393}, {0.144, 0.0280417}, {0.146,
  0.0280445}, {0.148, 0.0280476}, {0.15, 0.0280511}, {0.152,
  0.028055}, {0.154, 0.0280595}, {0.156, 0.0280645}, {0.158,
  0.02807}, {0.16, 0.0280763}, {0.162, 0.0280833}, {0.164,
  0.0280912}, {0.166, 0.0280999}, {0.168, 0.0281097}, {0.17,
  0.0281206}, {0.172, 0.0281328}, {0.174, 0.0281464}, {0.176,
  0.0281615}, {0.178, 0.0281783}, {0.18, 0.0281971}, {0.182,
  0.028218}, {0.184, 0.0282413}, {0.186, 0.0282672}, {0.188,
  0.028296}, {0.19, 0.0283281}, {0.192, 0.0283639}, {0.194,
  0.0284039}, {0.196, 0.0284482}, {0.198, 0.0284977}, {0.2,
  0.0285527}, {0.202, 0.0286138}, {0.204, 0.0286816}, {0.206,
  0.0287567}, {0.208, 0.0288395}, {0.21, 0.0289306}, {0.212,
  0.0290295}, {0.214, 0.0291373}, {0.216, 0.0292537}, {0.218,
  0.0293793}, {0.22, 0.0295111}, {0.222, 0.0296516}, {0.224,
  0.0298005}, {0.226, 0.0299582}, {0.228, 0.0301246}, {0.23,
  0.0303001}, {0.232, 0.0304852}, {0.234, 0.0306796}, {0.236,
  0.0308841}, {0.238, 0.0310988}, {0.24, 0.0313241}, {0.242,
  0.0315602}, {0.244, 0.0318074}, {0.246, 0.0320661}, {0.248,
  0.0323366}, {0.25, 0.0326192}, {0.252, 0.032914}, {0.254,
  0.0332216}, {0.256, 0.033542}, {0.258, 0.0338756}, {0.26,
  0.0342227}, {0.262, 0.0345836}, {0.264, 0.0349584}, {0.266,
  0.0353475}, {0.268, 0.0357511}, {0.27, 0.0361695}, {0.272,
  0.0366028}, {0.274, 0.0370513}, {0.276, 0.0375154}, {0.278,
  0.037995}, {0.28, 0.0384906}, {0.282, 0.0390024}, {0.284,
  0.0395304}, {0.286, 0.040075}, {0.288, 0.0406364}, {0.29,
  0.0412147}, {0.292, 0.0418102}, {0.294, 0.0424231}, {0.296,
  0.0430535}, {0.298, 0.0437017}, {0.3, 0.0443679}, {0.302,
  0.0450522}, {0.304, 0.0457549}, {0.306, 0.0464762}, {0.308,
  0.0472162}, {0.31, 0.0479752}, {0.312, 0.0487533}, {0.314,
  0.0495508}, {0.316, 0.0503678}, {0.318, 0.0512045}, {0.32,
  0.0520611}, {0.322, 0.0529379}, {0.324, 0.053835}, {0.326,
  0.0547527}, {0.328, 0.0556911}, {0.33, 0.0566504}, {0.332,
  0.0576308}, {0.334, 0.0586326}, {0.336, 0.059656}, {0.338,
  0.0607011}, {0.34, 0.0617683}, {0.342, 0.0628576}, {0.344,
  0.0639693}, {0.346, 0.0651037}, {0.348, 0.0662609}, {0.35,
  0.0674411}, {0.352, 0.0686447}, {0.354, 0.0698718}, {0.356,
  0.0711227}, {0.358, 0.0723975}, {0.36, 0.0736966}, {0.362,
  0.0750201}, {0.364, 0.0763683}, {0.366, 0.0777415}, {0.368,
  0.0791398}, {0.37, 0.0805635}, {0.372, 0.0820129}, {0.374,
  0.0834882}, {0.376, 0.0849897}, {0.378, 0.0865177}, {0.38,
  0.0880722}, {0.382, 0.0896538}, {0.384, 0.0912625}, {0.386,
  0.0928987}, {0.388, 0.0945626}, {0.39, 0.0962545}, {0.392,
  0.0979747}, {0.394, 0.0997233}, {0.396, 0.101501}, {0.398,
  0.103307}, {0.4, 0.105143}, {0.402, 0.107009}, {0.404,
  0.108904}, {0.406, 0.11083}, {0.408, 0.112786}, {0.41,
  0.114773}, {0.412, 0.116792}, {0.414, 0.11936}, {0.416,
  0.12099}, {0.418, 0.123056}, {0.42, 0.125215}, {0.422,
  0.127407}, {0.424, 0.129568}, {0.426, 0.131932}, {0.428,
  0.134226}, {0.43, 0.136468}, {0.432, 0.138785}, {0.434,
  0.141124}, {0.436, 0.143538}, {0.438, 0.145988}, {0.44,
  0.148472}, {0.442, 0.150992}, {0.444, 0.153548}, {0.446,
  0.15614}, {0.448, 0.158769}, {0.45, 0.161435}, {0.452,
  0.164138}, {0.454, 0.166878}, {0.456, 0.169657}, {0.458,
  0.172474}, {0.46, 0.175329}, {0.462, 0.178223}, {0.464,
  0.181157}, {0.466, 0.18413}, {0.468, 0.187143}, {0.47,
  0.190196}, {0.472, 0.19329}, {0.474, 0.196425}, {0.476,
  0.199601}, {0.478, 0.202819}, {0.48, 0.206078}, {0.482,
  0.209381}, {0.484, 0.212725}, {0.486, 0.216113}, {0.488,
  0.219544}, {0.49, 0.223019}, {0.492, 0.226539}, {0.494,
  0.230102}, {0.496, 0.233711}, {0.498, 0.237364}, {0.5,
  0.241064}, {0.502, 0.244809}, {0.504, 0.248601}, {0.506,
  0.252439}, {0.508, 0.256324}, {0.51, 0.260257}, {0.512,
  0.264238}, {0.514, 0.268266}, {0.516, 0.272344}, {0.518,
  0.27647}, {0.52, 0.280646}, {0.522, 0.284871}, {0.524,
  0.289146}, {0.526, 0.293472}, {0.528, 0.297849}, {0.53,
  0.302277}, {0.532, 0.306757}, {0.534, 0.311288}, {0.536,
  0.315873}, {0.538, 0.32051}, {0.54, 0.3252}, {0.542,
  0.329944}, {0.544, 0.334742}, {0.546, 0.339594}, {0.548, 0.344501}}
The problem mainly arises at higher values of x coordinate beyond 0.4 or so. Let me know if any other information is required.

