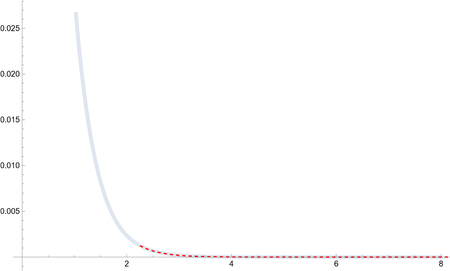
I would like to compare the numerical and analytical solution with plot for this example but something is wrong I don't know how to fix it?!!
      Clear["Global`*"]
      eqn = {2 s'[x] + 3 s[x]^2 - 3 f == 0};
      sol = NDSolveValue[{eqn /. {f -> 0.7}, s[0] == 1}, s[x], {x, 0, 8}];
      g[x_] := 1 - f/s[x]^2;
      pp1 = Plot[Evaluate[{g[x] /. {f -> 0.7}}], {x, 0, 8}]

     sol1 = DSolve[{2 w'[t] + 3 w[t]^2 - 3 p == 0, w[0] == 1}, w[t], t];
     p = 0.7;
     g1[t_] := 1 - p/w[t]^2;
     pp2 = Plot[g1[t] /. sol1, {t, 0, 15}, PlotStyle -> Dashed]
     Show[pp1, pp2]


g[x_] := 1 - f/s[x]^2 /. s[x] -> sol$\endgroup$