We can use one of the zeroCrossing functions from the answers to this question to construct solutions to where an ordered list of points representing a curve crosses a surface $f(x,y,z)=0$. There are some very nice answers to the linked question with good explanations of the solutions. Use one that returns an interval of indices where the crossing takes place ,such as whuber's answer
zeroCrossings[l_List] := Module[{t, u, v},
  t = {Sign[l], Range[Length[l]]} // Transpose; (*List of-1,0,1 only*)
  u = Select[t, First[#] != 0 &];               (*Ignore zeros*)
  v = Split[u, First[#1] == First[#2] &];       (*Group into runs of+and- values*)
  {Most[Max[#[[All, 2]]] & /@ v], Rest[Min[#[[All, 2]]] & /@ v]} // Transpose]
or the SparseArray version in Mr.Wizard's answer, which seems to be quite efficient.
zeroCrossings[l_List] :=
 With[{c = SparseArray[l]["AdjacencyLists"]}, {c[[#]], c[[# + 1]]}\[Transpose] &@
   SparseArray[Differences@Sign@l[[c]]]["AdjacencyLists"]]
The OP's curve points, for which I suppose the corresponding values of t may be lost or unknown:
dt = Table[{Sin[3 t] Cos[1 t], Sin[t] Sin[5 t], Sin[2 t]}, {t, -10, 10, 0.005}];
To help you understand the functions below, I first give the output of zeroCrossings. For the OP's example, we would be interest when z - 0.5 is zero. We translate down the z coordinates of points dt by 0.5 and search for the zero crossings of the translated z coordinates.
zeroCrossings[Last /@ dt - 0.5]
{{168, 169}, {377, 378}, {796, 797}, {1006, 1007}, {1425, 1426},
 {1634, 1635}, {2053, 2054}, {2262, 2263}, {2681, 2682}, {2891, 2892},
 {3309, 3310}, {3519, 3520}, {3938, 3939}}
Each pair are the indices of points lying on either side of z == 0.5.
Below I use linear interpolation to find the crossing point, which seems simplest. The function zeroPt returns the point where f is zero corresponding to the zero crossing interval crossIDX. The function zeroTime returns the "time", interpolated between the indices of the crossing.
zeroPt[pts_, crossIDX_, f_] /; Length[crossIDX] >= 3 :=
  Mean[pts ~Part~ crossIDX[[2 ;; -2]]]; (* unlikely >= 4 - return all zero points? *)
zeroPt[pts_, crossIDX_, f_] /; Length[crossIDX] == 2 :=
  (#2 f[#1] - #1 f[#2])/(f[#1] - f[#2]) & @@ pts[[crossIDX]];

zeroTime[pts_, idx_, f_] /; Length[idx] >= 3 := Mean[idx];
zeroTime[pts_, idx_, f_] /; Length[idx] == 2 := First[idx] + Rescale[0., f /@ pts[[idx]]];
OP's Example
zeroTime[dt, #, Last[#] - 0.5 &] & /@ zeroCrossings[Last /@ dt - 0.5]
{168.405, 377.843, 796.723, 1006.16, 1425.04, 1634.48, 2053.36, 2262.8,
 2681.68, 2891.12, 3310., 3519.44, 3938.32}
int = zeroPt[dt, #, Last[#] - 0.5 &] & /@ zeroCrossings[Last /@ dt - 0.5]
{{0.682995, 0.249992, 0.5}, {-0.183003, 0.249985, 0.5}, {0.682998, 0.249994, 0.5},
 {-0.183003, 0.249984, 0.5}, {0.68301, 0.249999, 0.5}, {-0.182995, 0.24997, 0.5},
 {0.682996, 0.249993, 0.5}, {-0.183001, 0.249981, 0.5}, {0.682997, 0.249993, 0.5},
 {-0.183005, 0.249988, 0.5}, {0.683012, 0.25, 0.5}, {-0.182995, 0.249971, 0.5},
 {0.682997, 0.249993, 0.5}}
If the curve is an orbit or other periodic trajectory, then the one might be interested in the unique intersections. One can gather the clusters of points with this function and take the Mean to approximate the intersection.
clusters[pts_, dist_] := Gather[pts, EuclideanDistance[##] < dist &];
Example:
Mean /@ clusters[int, 0.001]
{{0.683001, 0.249995, 0.5}, {-0.183, 0.24998, 0.5}}
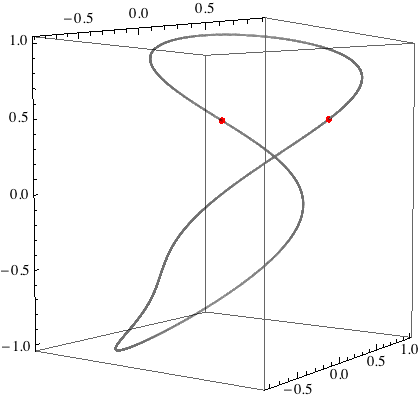
A plot of the results:
Graphics3D[{
  {Opacity[0.1], PointSize[Small], Point @ dt},
  {Red, PointSize[Medium], Point[Mean /@ clusters[int, 0.001]]}},
  Axes -> True]
Arbitrary planes
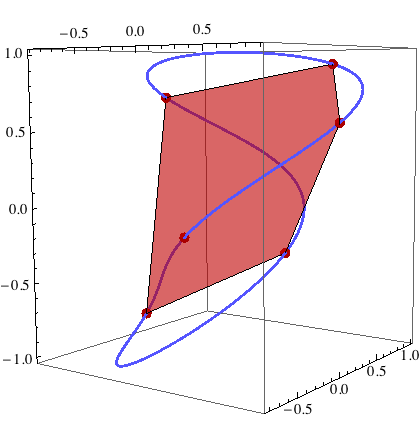
We can apply the method to arbitrary planes. A function plane defining the plane, plane[x, y, z] == 0, is applied to the points and we find where the values cross zero; the function is needed in both zeroCrossings and zeroPt.
Here we will use ConvexHull to show the plane via a polygon containing all the intersection points. We have to project the points onto a plane, which must be chose judiciously so that the projected points are not all collinear, if possible.
Needs["ComputationalGeometry`"]

plane[x_, y_, z_] := 2 x - 3 y - 2 z + 0.5;
With[{intersections = zeroPt[dt, #, plane @@ # &] & /@ zeroCrossings[plane @@@ dt]},
 Graphics3D[{
   {Lighter@Blue, PointSize[Small], Point@dt},
   {Darker@Red, PointSize[Large], Point[intersections],
    Red, Opacity[0.6],
    Polygon[#[[ConvexHull[Most /@ #]]] &[Mean /@ clusters[intersections, 0.001]]]}},
  Axes -> True]
 ]
Other surfaces
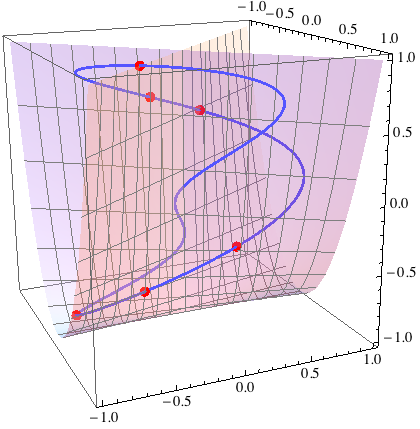
The method works to find where any function of the points crosses zero (in this case surf).
param[u_, v_] := {u v, u, 2 v^2 - 1};
surf[x_, y_, z_] := Evaluate[Subtract @@ Eliminate[{x, y, z} == param[u, v], {u, v}]];
Show[
 With[{intersections = zeroPt[dt, #, surf @@ # &] & /@ zeroCrossings[surf @@@ dt]},
  Graphics3D[{
    {Lighter@Blue, PointSize[Small], Point@dt},
    {Red, PointSize[Large],
     Point[Mean /@ clusters[intersections, 0.001]]}}, Axes -> True]],
 ParametricPlot3D[param[u, v], {u, -1, 1}, {v, -1, 1},
  MeshStyle -> Gray, PlotStyle -> Opacity[0.3]]
 ]
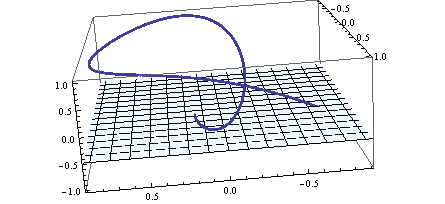


zeroCrossings[Last /@ dt - 0.5]orzeroCrossings[plane @@@ dt], whereplane[x, y, z] == 0is the equation of the plane, to find the points between which the crossing occurs. $\endgroup$