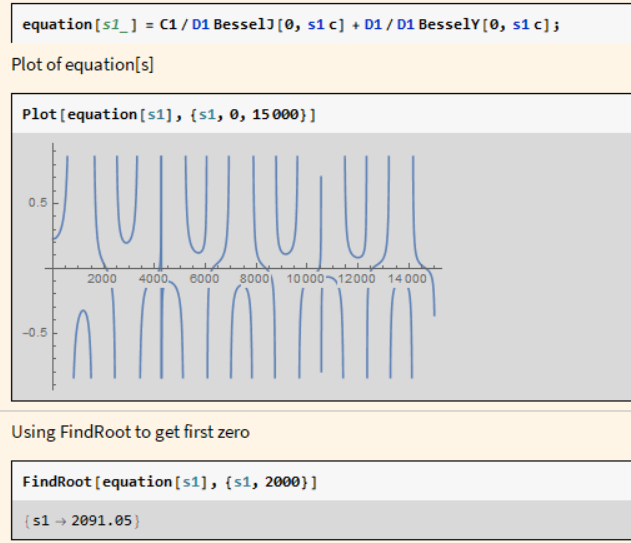
Clear["Global`*"]

equation[s1_] = C1/D1 BesselJ[0, s1 c] + D1/D1 BesselY[0, s1 c];

c = 1/300; C1 = 1; D1 = 1;
With Solve or NSolve or Reduce, include a constraint on the range of s1. Since you are plotting on the interval {0, 15000}, use the constraint 0 <= s1 <= 15000
(roots = Solve[{equation[s1] == 0, 0 <= s1 <= 15000}, s1, Reals]) // N

(* Solve::incs: Warning: Solve was unable to prove that the solution set found is complete.

{{s1 -> 69.0992}, {s1 -> 953.787}, {s1 -> 1890.83}, {s1 -> 2831.38}, {s1 ->
   3772.88}, {s1 -> 4714.77}, {s1 -> 5656.85}, {s1 -> 6599.05}, {s1 ->
   7541.31}, {s1 -> 8483.63}, {s1 -> 9425.97}, {s1 -> 10368.3}, {s1 ->
   11310.7}, {s1 -> 12253.1}, {s1 -> 13195.5}, {s1 -> 14138.}} *)
With exact input, the roots are exact
equation[s1] /. roots // FullSimplify

(* {0, 0, 0, 0, 0, 0, 0, 0, 0, 0, 0, 0, 0, 0, 0, 0} *)
Or numerically,
equation[s1] /. N[roots, 20]

(* {0.*10^-20, 0.*10^-19, 0.*10^-18, 0.*10^-21, 0.*10^-21, 0.*10^-21, 0.*10^-21,
 0.*10^-20, 0.*10^-20, 0.*10^-20, 0.*10^-20, 0.*10^-20, 0.*10^-20, 0.*10^-20,
 0.*10^-20, 0.*10^-20} *)
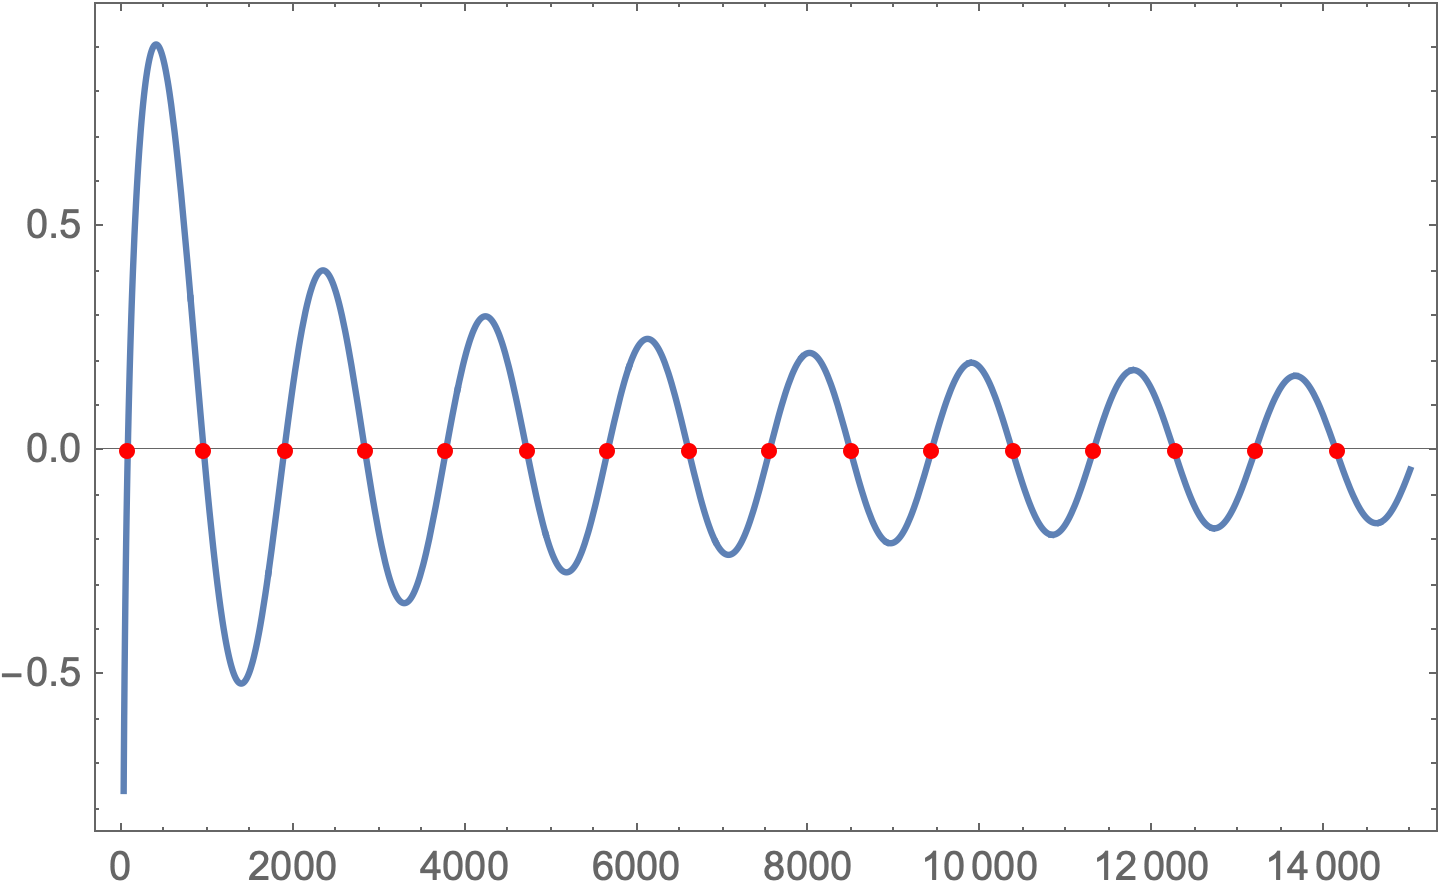
Graphically,
Plot[equation[s1], {s1, 0, 15000}, Frame -> True,
 Epilog -> {Red, AbsolutePointSize[4],
   Point[{s1, 0} /. roots]}]


PlotandFindRoot? Many thanks in advance! $\endgroup$InputForm) rather than images. Code should include all data (e.g., numeric values of parameters) needed to reproduce the problem. $\endgroup$