21
$\begingroup$

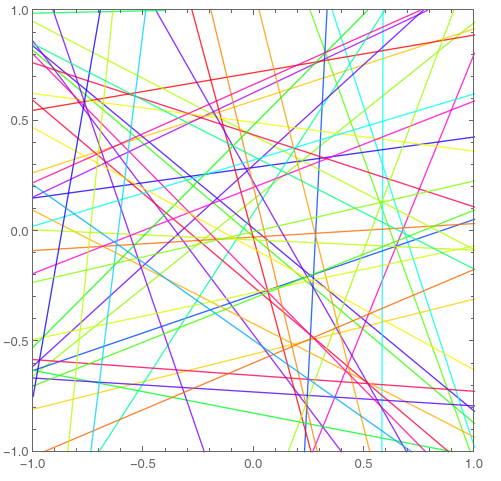
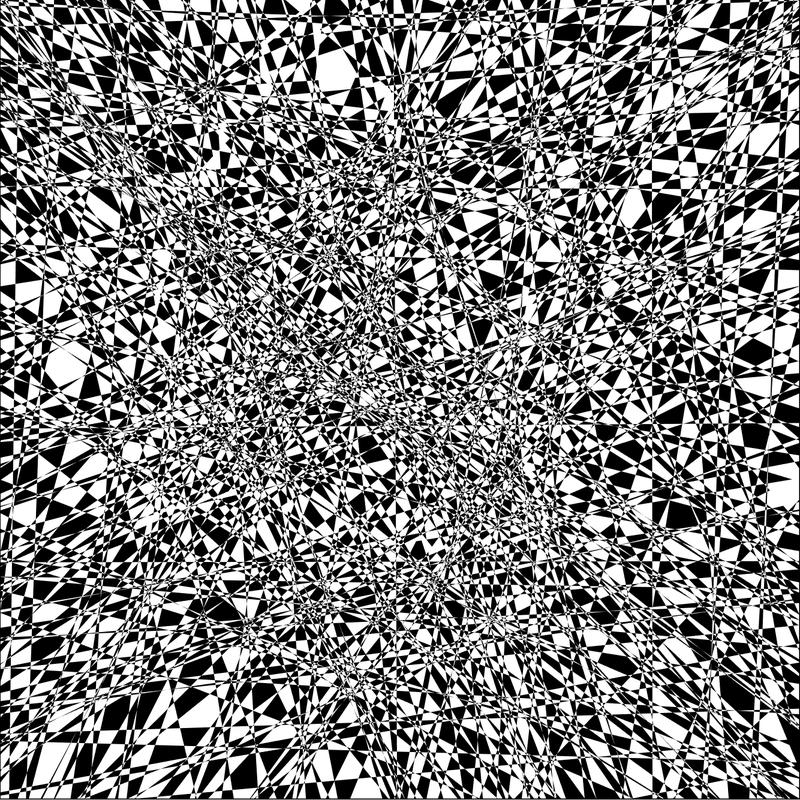
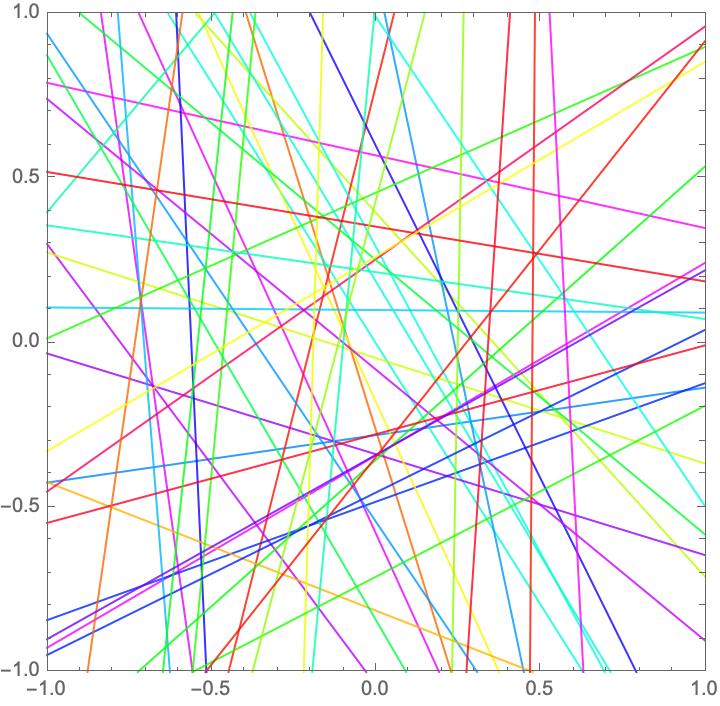
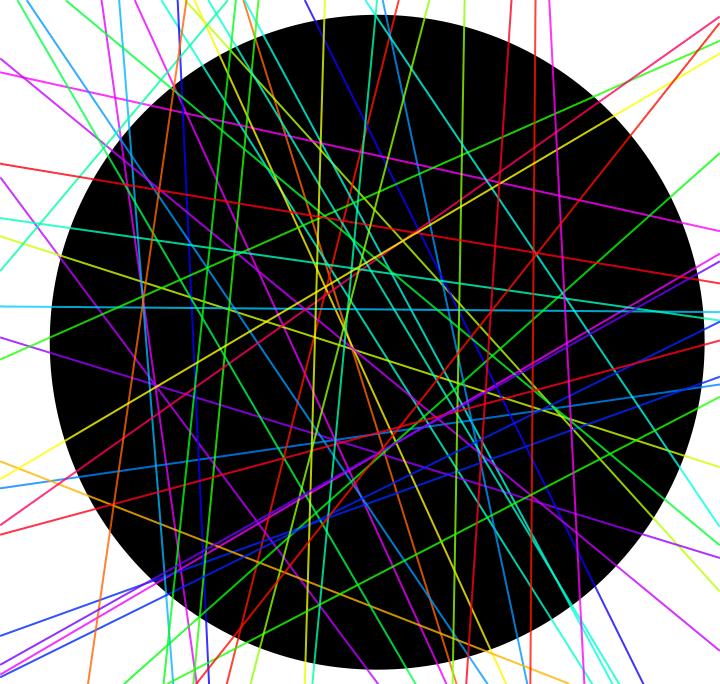
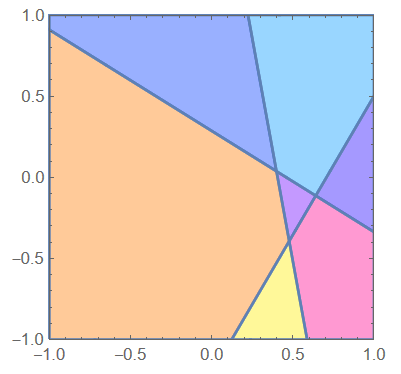
Given a shape (e.g., a rectangle, a circle, etc.), how to divide it by $n$ randomly chosen lines. It is trivial to plot those lines (see figure below), using code like

Graphics[Table[{Hue[RandomReal[]], Opacity[0.8], 
   InfiniteLine[RandomReal[{-1, 1}, {2, 2}]]}, {49}], 
 PlotRange -> {{-1, 1}, {-1, 1}}, Frame -> True]

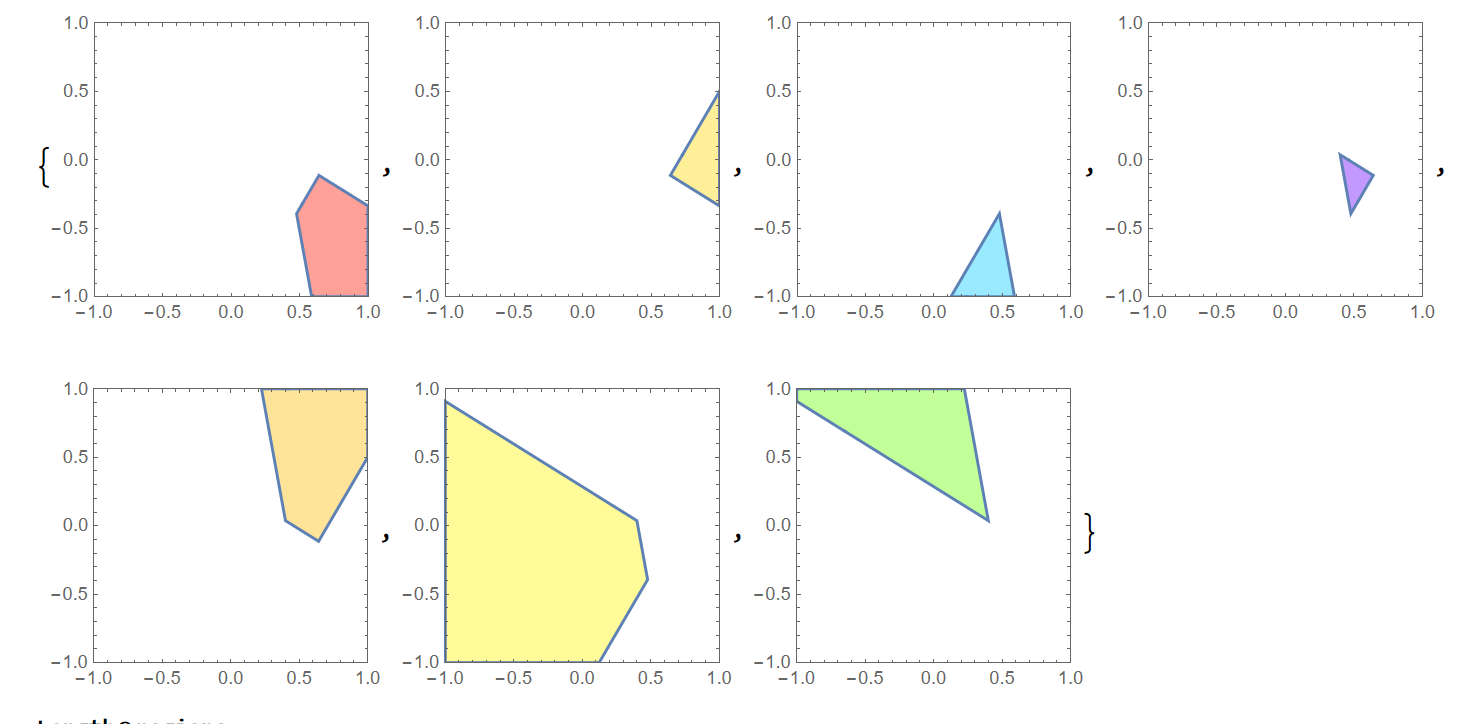
But how to extract the (many) regions in the figure? There are some posts doing similar things to an image (https://community.wolfram.com/groups/-/m/t/388948), but I am not sure how to do that to geometric shapes. Thanks!

random lines

$\endgroup$
1
  • $\begingroup$ In what format would you like to obtain the resulting regions? $\endgroup$
    – MarcoB
    Commented Apr 21, 2022 at 22:20

5 Answers 5

23
$\begingroup$

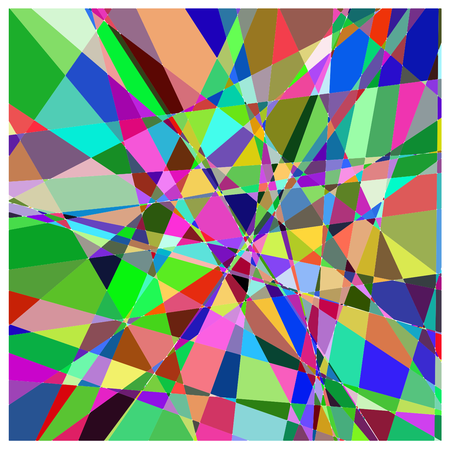
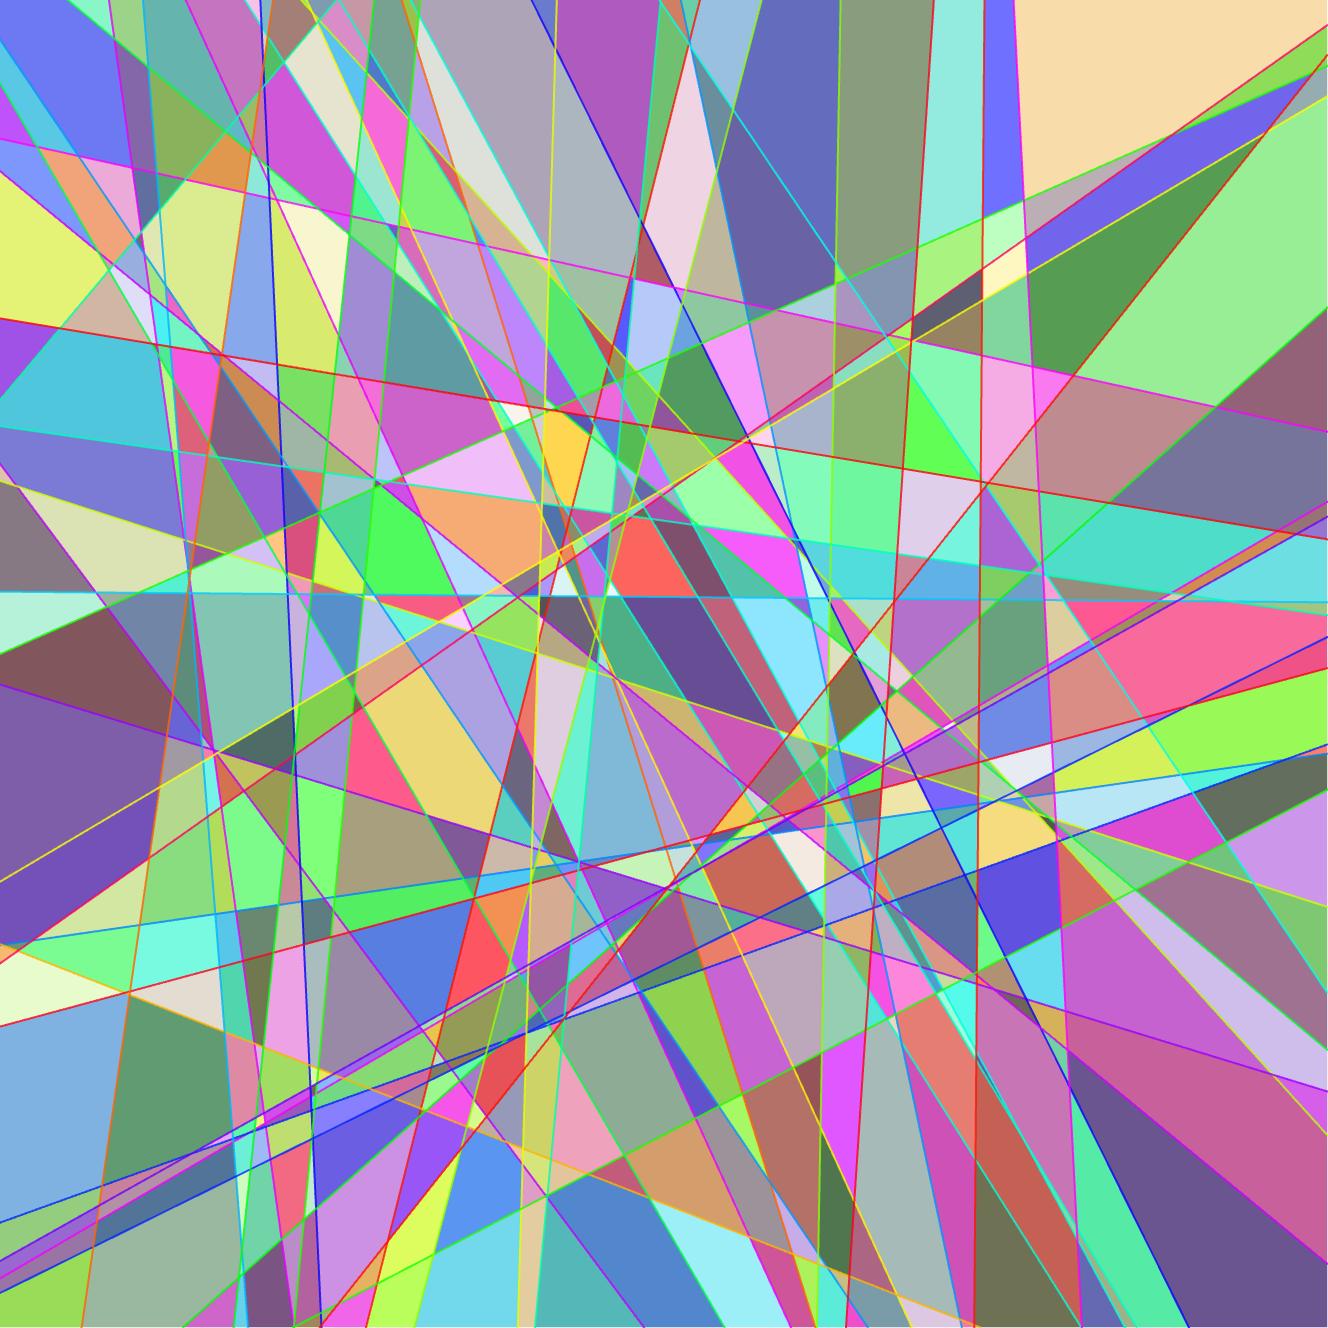
You can find symbolic connected components (which are those regions you are asking about) in this case using CylindricalDecomposition. This can be a bit of an overkill if your goal is only to visualize these regions between lines, but it is such a useful feature and extends to general semialgebraic sets, and thus I outline this solution and its extensions below.

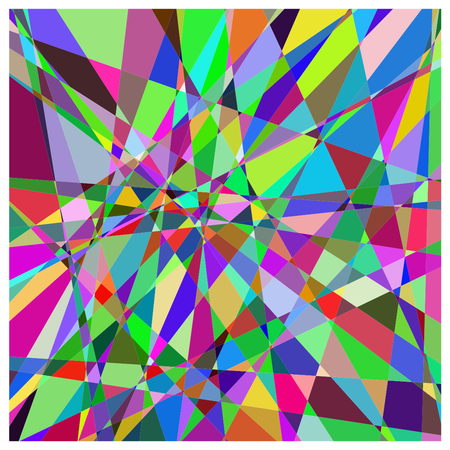
Below I first construct the rectangle and remove the lines (with rationalized random numbers) from it, splitting it to pieces. After this I compute equations representing these regions, and massage them a bit to make the input more palatable to CylindricalDecomposition which can extract the wanted regions using the "Components" topological operation. After this I reconstruct implicit regions from the resulting list of equations, discretize them, colour them randomly and show them.

RegionDifference[
     Rectangle[{-1, -1}, {1, 1}], 
     RegionUnion@
      Table[InfiniteLine[Rationalize[RandomReal[{-1, 1}, {2, 2}], 0]], {49}]] //
    Refine[RegionMember[#, {x, y}], Element[x | y, Reals]] & // 
   CylindricalDecomposition[#, {x, y}, "Components"] & //
  Map[Style[
     Quiet@BoundaryDiscretizeRegion@ImplicitRegion[#, {x, y}],
     RandomColor[]] &] // Graphics
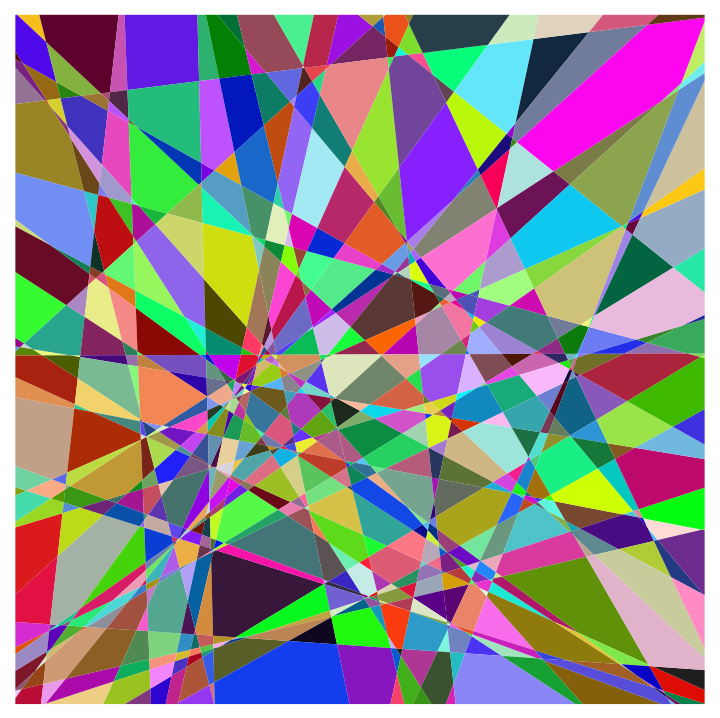
enter image description here

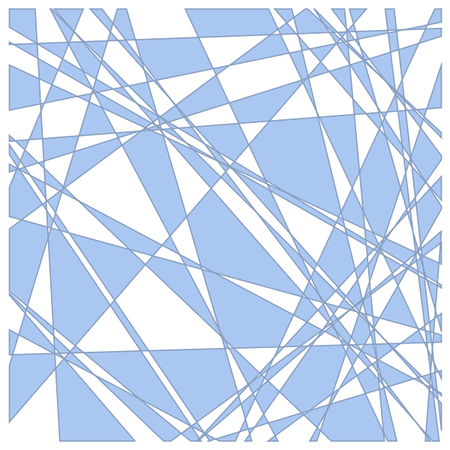
This method is not fast for large numbers of lines, but CylindricalDecomposition can extract all components for these kind of problems, and the rest of the code visualises all of those which have nonzero area. One could improve this solution by two-colouring the result, but that's a different task.

EDIT:

Although planar graphs are four-colourable, these graphs are two-colourable, meaning that only two colours are necessary to paint all regions with shared side with a differing colour. @cvgmt presents a fast method for two-colouring for this specific task using HalfSpaces and RegionSymmetricDifference, while the code below is more general purpose. (Unfortunately RegionSymmetricDifference can suffer from discretization issues, but that's another story - and I have a workaround for a similar problem below.)

Code below constructs symbolically the side-adjacency graph from a list of regions after splitting the region (as above) with a bit of trickery (the odd replacement rule could be replaced with CylindricalDecomposition[..., "Closure"], but that would result more complicated and thus more time-consuming operations down the line), and computes a colouring for it, visualising it in the end.

NOTE: Why did I comment out ParallelMap? Because apparently CylindricalDecomposition[..., "Components"] fails for many, if not all less trivial inputs on older Mathematica versions when parallel kernels are in use. This issue has been fixed in 13.1. You can effectively run this code with ParallelMap once on a fresh session, but not more than that.

With[{basereg = Rectangle[{-1, -1}, {1, 1}],
  lines = 
   Table[InfiniteLine[Rationalize[RandomReal[{-1, 1}, {2, 2}], 0]], {20}]},
 RegionMember[RegionDifference[basereg, RegionUnion@lines], {x, y}] //
                          Refine[#, Element[x | y, Reals]] & //
            CylindricalDecomposition[#, {x, y}, "Components"] & //
           Map[ImplicitRegion[#, {x, y}] &] //
          (# /. {Greater ->
                GreaterEqual, GreaterEqual -> Greater, 
              Less -> LessEqual, LessEqual -> Less}) & //
         Subsets[#, {2}] & //
        (*Parallel*)Map[
          Quiet@
            If[
             RegionDisjoint @@ # || 
              RegionDimension[RegionIntersection @@ #] == 0, 
             Nothing, #] &, #] & //
       Map[Apply@UndirectedEdge] //
       SimpleGraph //
     {(*Parallel*)Map[Quiet@BoundaryDiscretizeRegion[#] &, VertexList[#](*,
        Method->"FinestGrained"*)],
       FindVertexColoring[#, Lighter@Take[ColorData[97, "ColorList"], 2]]} & //
    Transpose // Map[Apply@Style] //
  Graphics[{#, 
     MeshPrimitives[
      DiscretizeRegion@RegionIntersection[basereg, RegionUnion@lines], 1]}] &]
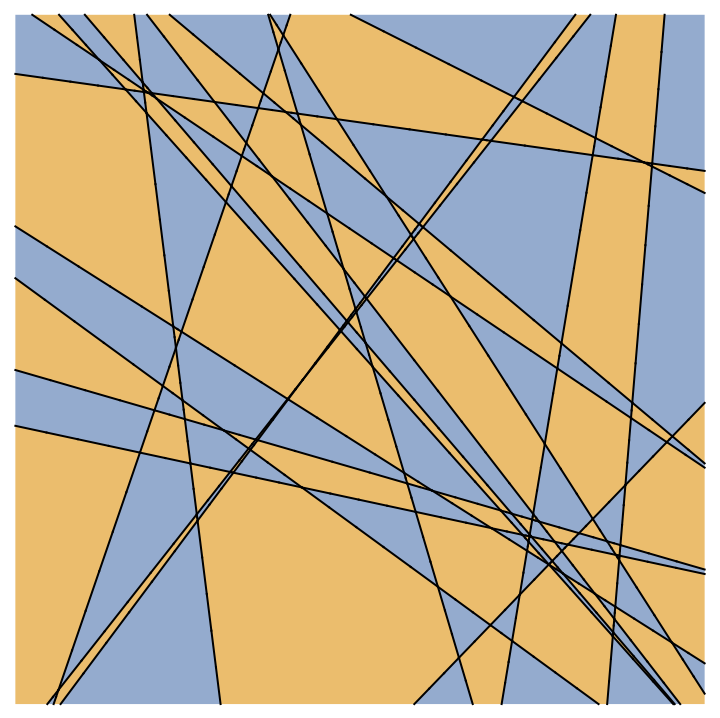
enter image description here

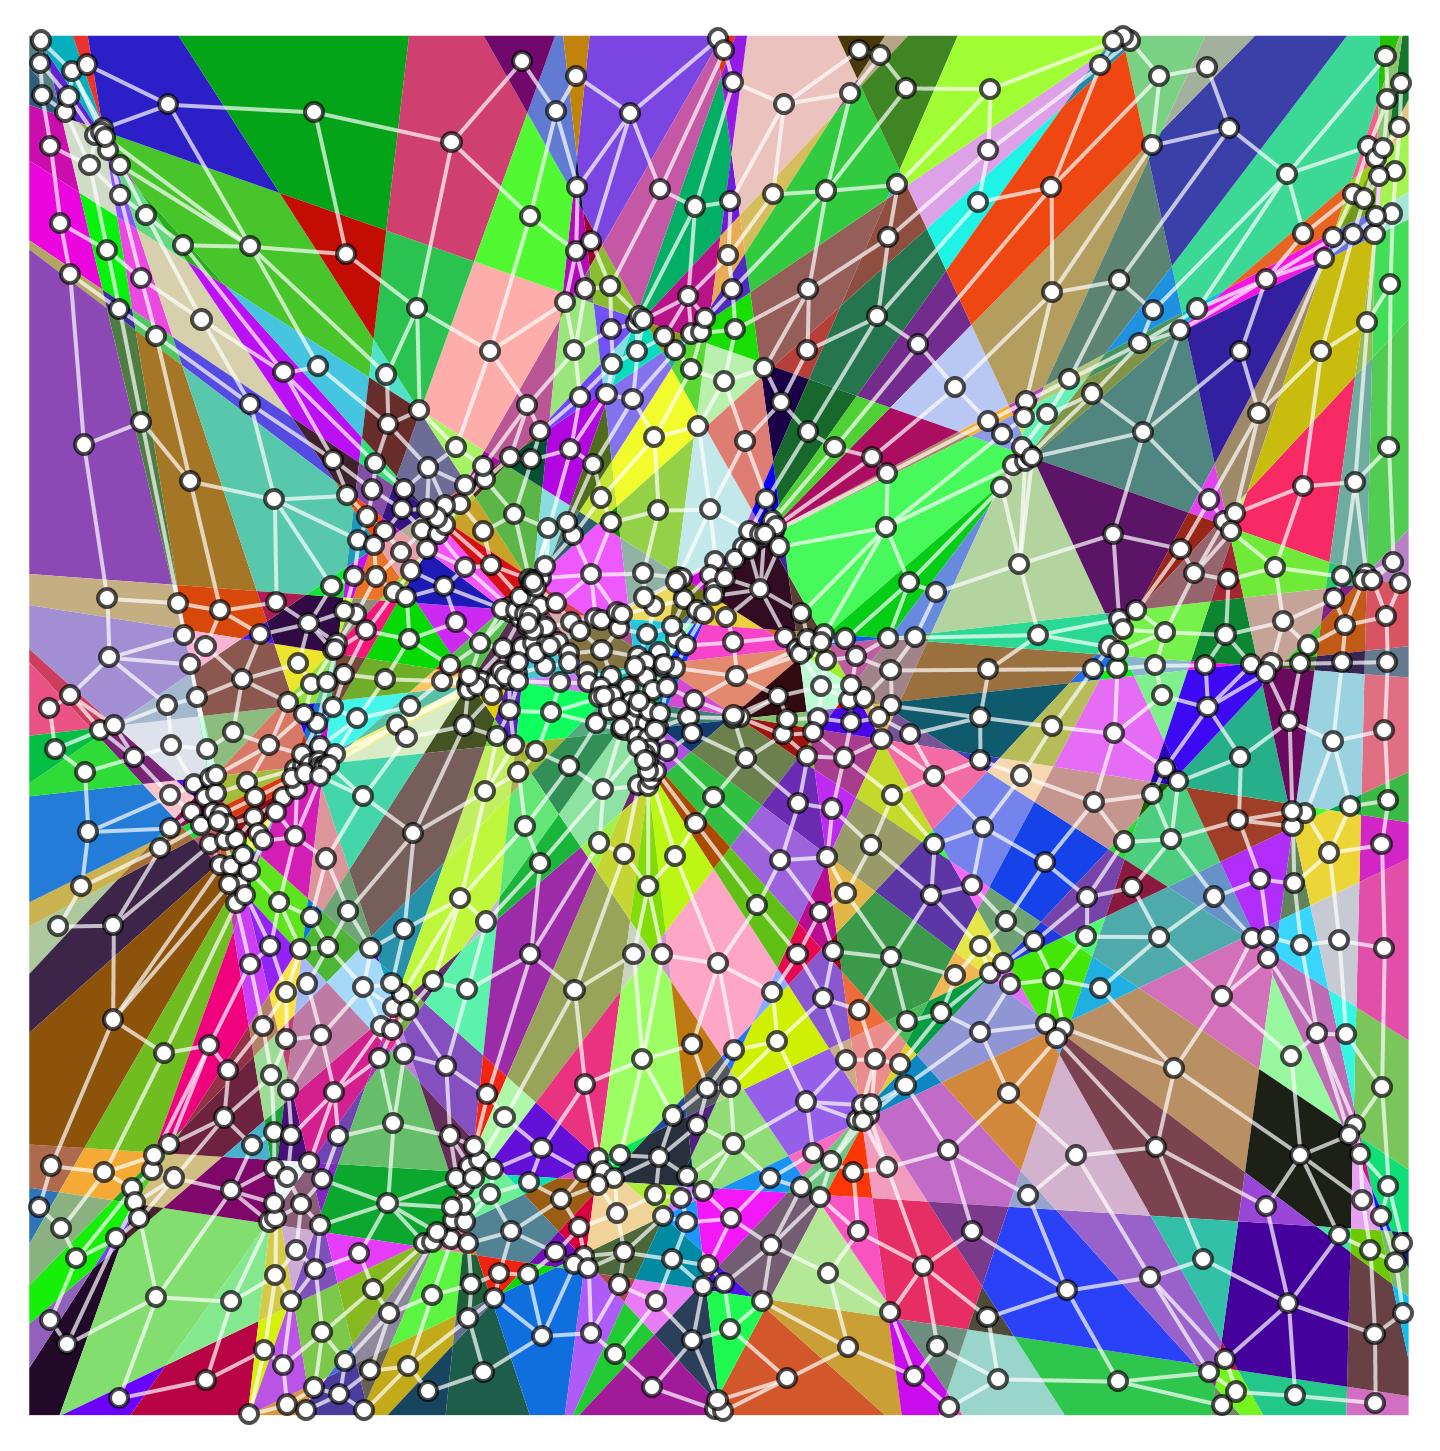
It is also possible to visualise the graph which was used to generate the colouring:

With[{basereg = Rectangle[{-1, -1}, {1, 1}],
  lines = 
   Table[InfiniteLine[Rationalize[RandomReal[{-1, 1}, {2, 2}], 0]], {8}]},
 With[{g = 
    RegionMember[
             RegionDifference[basereg, RegionUnion@lines], {x, y}] //
                        Refine[#, Element[x | y, Reals]] & //
              CylindricalDecomposition[#, {x, y}, "Components"] & //
          Map[ImplicitRegion[#, {x, y}] &] //
         (# /. {Greater -> 
             GreaterEqual, GreaterEqual -> Greater, 
             Less -> LessEqual, LessEqual -> Less}) & //
        Subsets[#, {2}] & //
       (*Parallel*)Map[
         Quiet@
           If[
            RegionDisjoint @@ # || 
             RegionDimension[RegionIntersection @@ #] == 0, 
            Nothing, #] &, #] & //
      Map[Apply@UndirectedEdge] // 
     SimpleGraph[#, VertexShape -> Graphics@Circle[], 
       VertexCoordinates -> (RegionCentroid /@ VertexList[#])] &},
  {(*Parallel*)Map[Quiet@BoundaryDiscretizeRegion[#] &, VertexList[g](*,Method->
       "FinestGrained"*)],
      FindVertexColoring[g, Lighter@Take[ColorData[97, "ColorList"], 2]]} //
     Transpose // Map[Apply@Style] //
   Show[Graphics[{#, 
       MeshPrimitives[
        DiscretizeRegion@
         RegionIntersection[basereg, RegionUnion@lines], 1]}], g] &]]
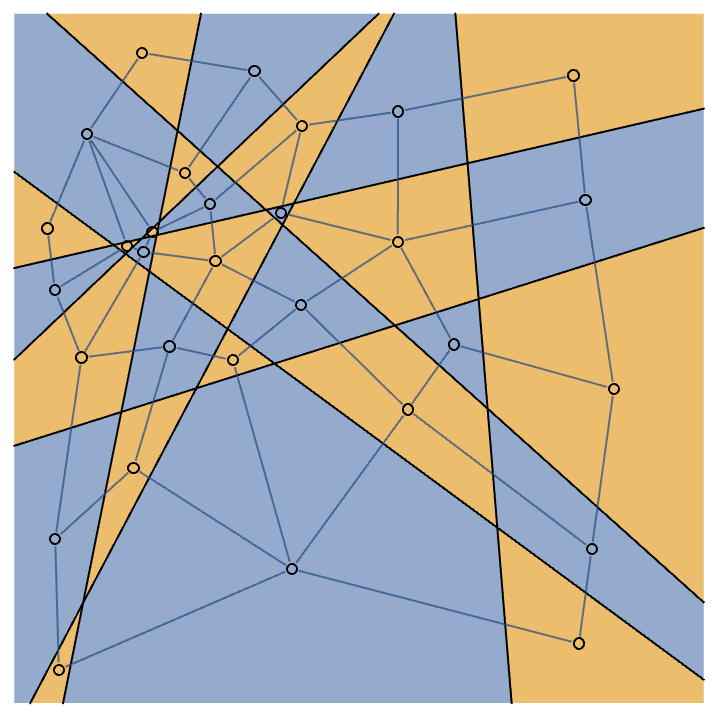
enter image description here

One more example with some less random lines:

lines = DeleteDuplicates@Join[
    Table[Rationalize[InfiniteLine[{0, 0}, N@{Sin[a], Cos[a]}], 0],
     {a, 0, 2 Pi, 2 Pi/3}],
    Table[
     Rationalize[InfiniteLine[-{1, 1}/2, N@{Sin[a], Cos[a]}], 0],
     {a, 0, 2 Pi, 2 Pi/5}],
    Table[Rationalize[InfiniteLine[{1, 1}/2, N@{Sin[a], Cos[a]}], 0],
     {a, 0, 2 Pi, 2 Pi/7}],
    Table[InfiniteLine[
      Rationalize[RandomPoint[Disk[{0, 0}, Sqrt[2]]], 0],
      Rationalize[RandomPoint[Circle[]], 0]], {2}]]}
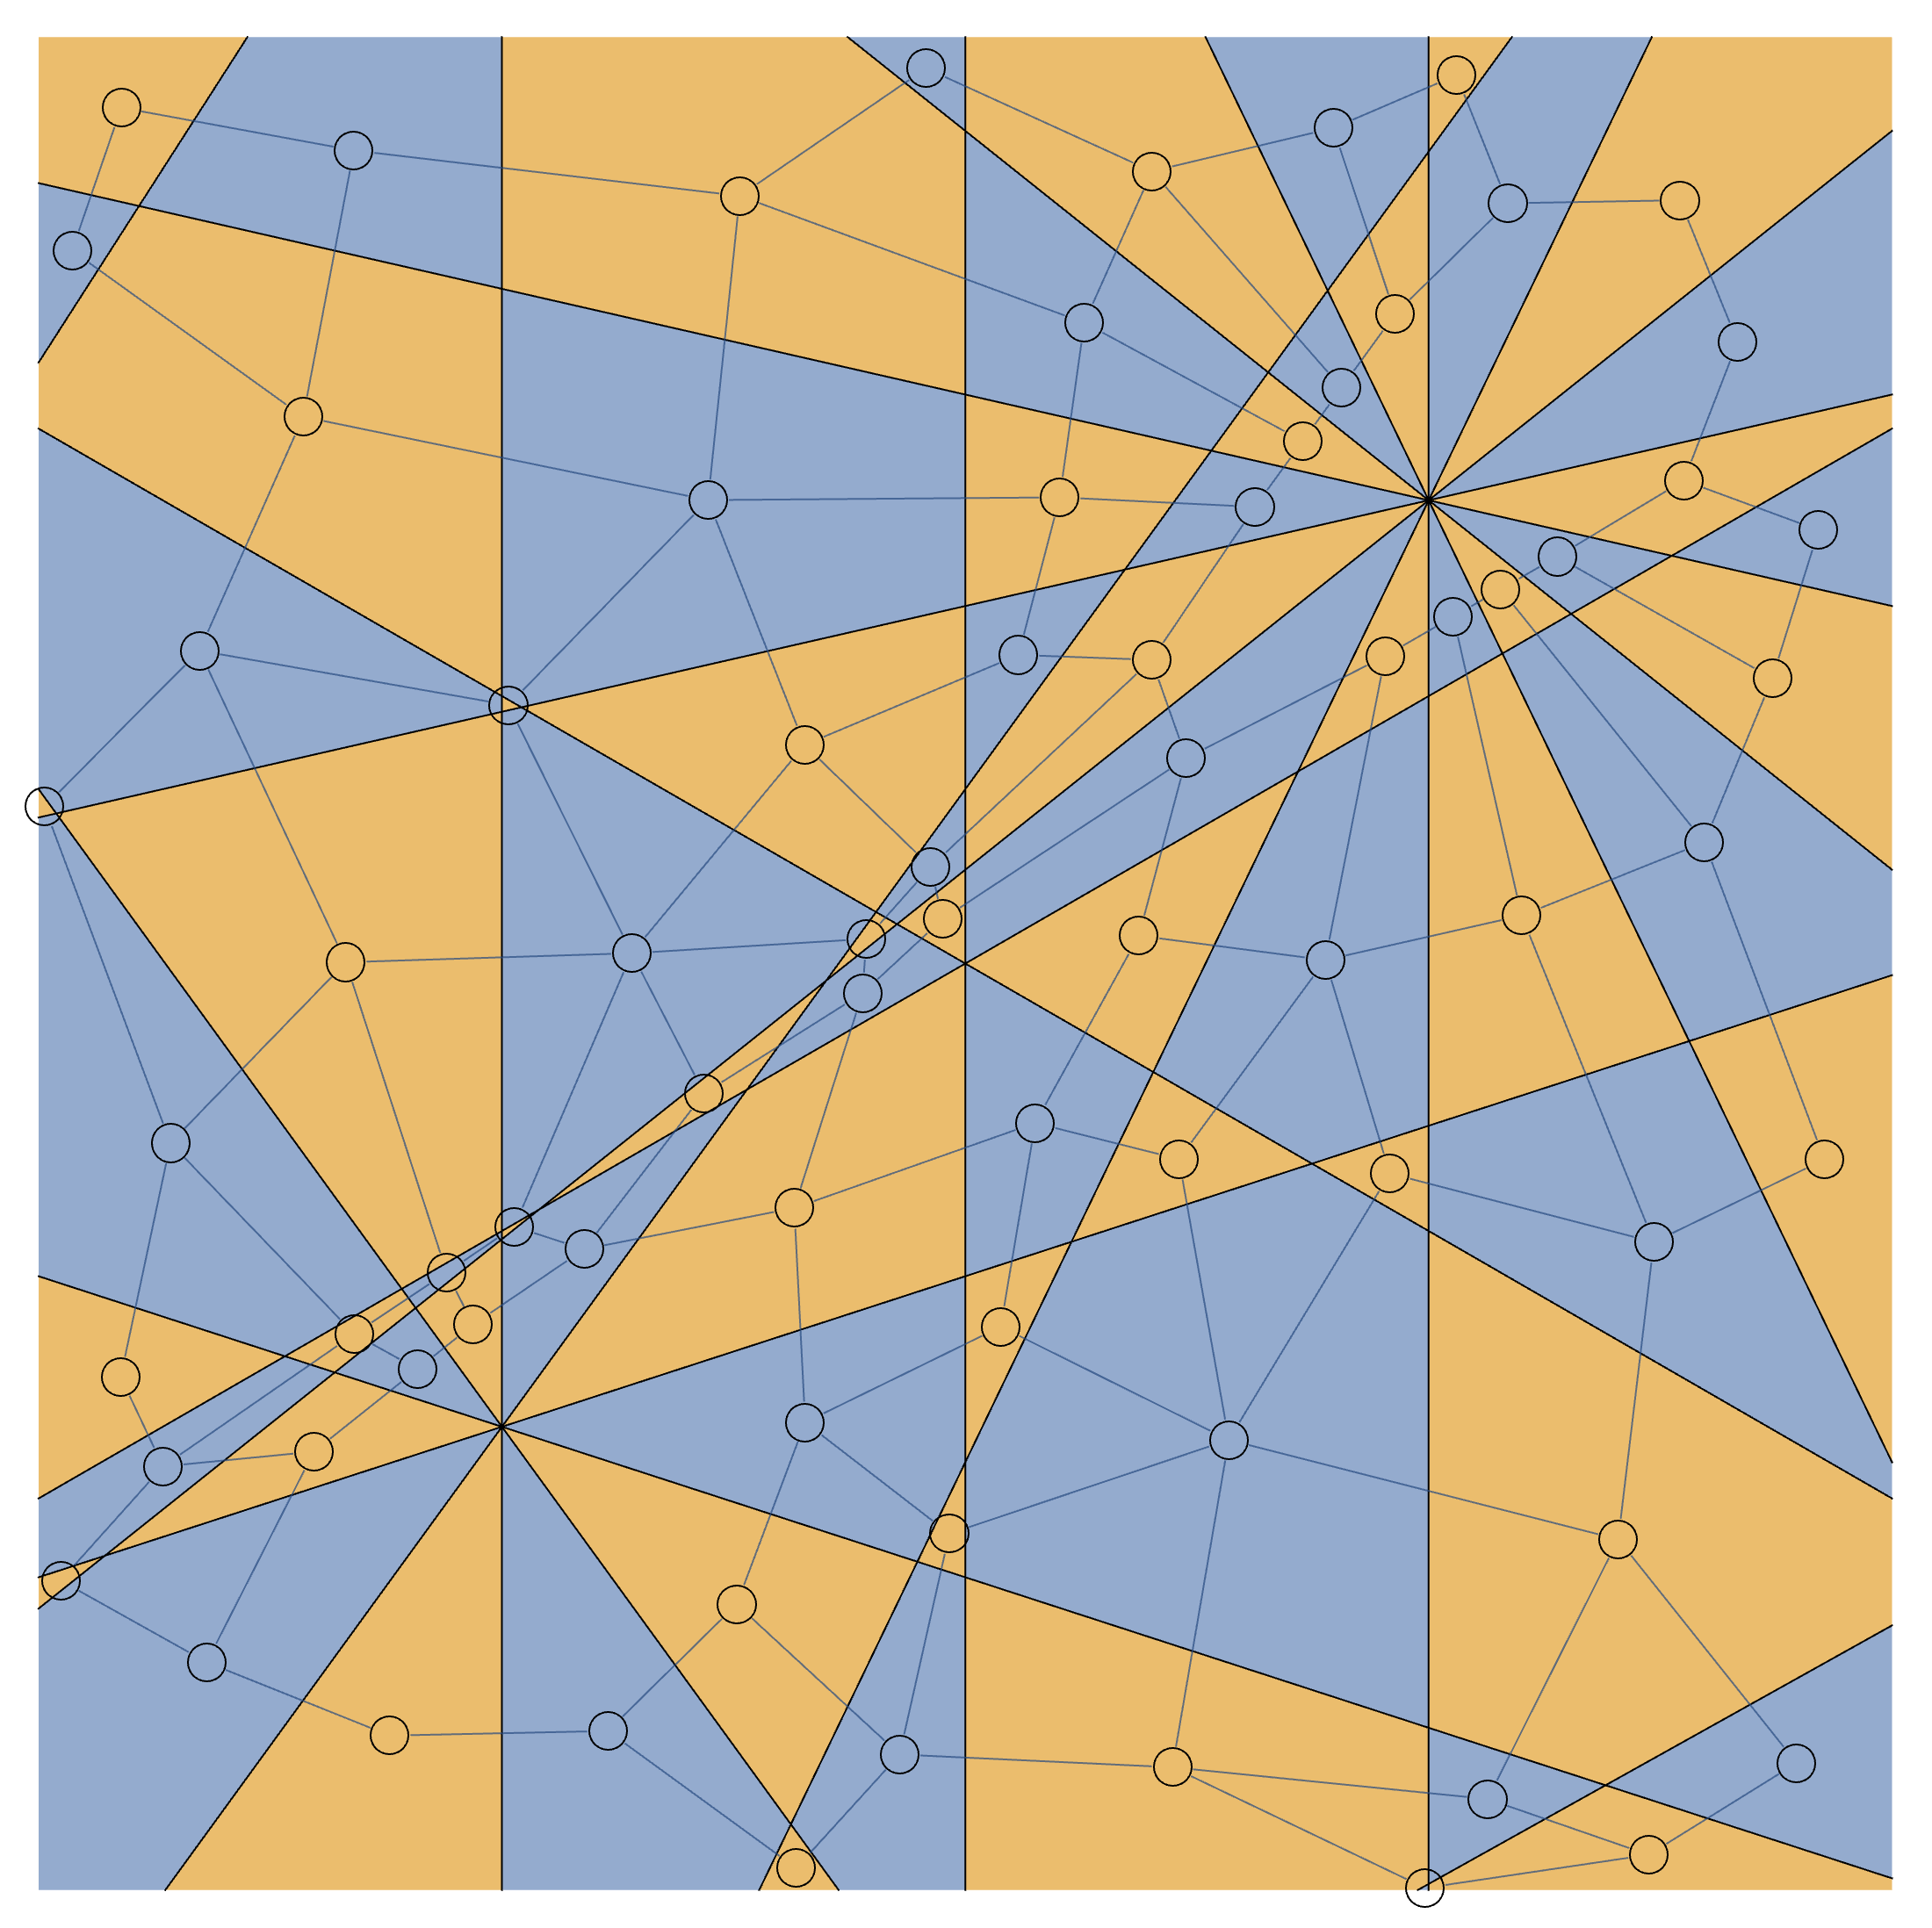
enter image description here

Technically speaking this approach is not limited to rectangles and lines, but can actually handle general semialgebraic sets. The process of getting good renderings and even getting the code to evaluate without running out of memory becomes more finicky in this case, though. For instance one should rationalize numbers at coarser accuracy and some hacks on discretizing implicit regions may be necessary.

Interestingly the hardest problem to work around seems to be discretizing cusps on implicit subregions completely. (This is done purely for visualization purposes.) My hack here is effectively rasterizing them.

Since intersections with Circles can produce non-convex regions (unlike plain InfiniteLines), RegionCentroid for VertexCoordinates may put the graph vertex outside its region. To hack around this, RegionCentroid and its closest corresponding point on the (discretized) region boundary are computed and the local minimum of SignedRegionDistance on the line defined by them is searched, starting between these points. This produces reasonably aesthetic results, usually keeping graph edges from intersecting, and generally better than just minimizing SignedRegionDistance which can put the point in quite an extreme spot on the region.

ClearAll[implicitRegionDiscretize];
implicitRegionDiscretize[reg_ImplicitRegion, 
  bbox : {{x1_, x2_}, {y1_, y2_}}, step_] :=
 With[{f = Compile[{{x, _Real}, {y, _Real}},
     Evaluate[
      Boole@
       Refine[RegionMember[reg, {x, y}], Element[x | y, Reals]]],
     CompilationOptions -> {"ExpressionOptimization" -> True, 
       "InlineCompiledFunctions" -> True}, 
     RuntimeAttributes -> {Listable}, RuntimeOptions -> "Speed", 
     CompilationTarget -> "C"]},
  ImageMesh[Image@Table[f[x, y],
     {y, Reverse@Subdivide[N@y1, y2, Max[200, Round[(y2 - y1)/step]]]},
     {x, Subdivide[N@x1, x2, Max[200, Round[(x2 - x1)/step]]]}],
   Method -> "LinearSeparable", DataRange -> bbox]]

With[{basereg = RegionSymmetricDifference @@ Table[
     Disk[Rationalize[N[{Sin[a], Cos[a]}/2], 1/1000], 1], 
     {a, 0, 5 Pi/3, 2 Pi/3}]},
 With[{lines = DeleteDuplicates@Join[Table[
       Circle[Rationalize[N[{Sin[a], Cos[a]}/2], 1/1000], 1],
       {a, 0, 5 Pi/3, 2 Pi/3}],
      Table[
       InfiniteLine[
        Rationalize[RandomPoint[basereg], 1/1000],
        Rationalize[RandomPoint[Circle[]], 1/1000]], {10}],
      Table[Circle[
        Rationalize[RandomPoint[basereg], 1/1000],
        Rationalize[RandomReal[{1/4, 1/2}], 1/1000]], {10}]],
   bbox = RegionBounds@basereg}, 
  With[{g = 
     RegionMember[
                RegionDifference[basereg, RegionUnion@lines], {x, y}] //
               Refine[#, Element[x | y, Reals]] & //
              CylindricalDecomposition[#, {x, y}, "Components"] & //
             Map[ImplicitRegion[#, {x, y}] &] //
            (# /. {Greater -> GreaterEqual,
                 GreaterEqual -> Greater, Less -> LessEqual, 
                LessEqual -> Less}) & //
           Subsets[#, {2}] & //
          ParallelMap[
            Quiet@
              If[
               RegionDisjoint @@ # || 
                RegionDimension[RegionIntersection @@ #] == 0, 
               Sequence @@ #, #] &, #, Method -> "FinestGrained"] & //
         Replace[#, {l_List :> UndirectedEdge @@ l, 
            r_ImplicitRegion :> UndirectedEdge[r, r]}, {1}] & //
           SimpleGraph // 
       VertexReplace[#, 
         Rule @@@ 
          Transpose@{VertexList[#], 
            ParallelMap[
             implicitRegionDiscretize[#, RegionBounds@#, 1/1000] &, 
             VertexList[#], Method -> "FinestGrained"]}] & //
      Graph[#, VertexShape -> Graphics@Circle[],
        VertexCoordinates ->(*Parallel*)Map[
          With[{a = RegionCentroid@#},
            With[{b = RegionNearest[RegionBoundary@#, a]}, 
             a + c (b - a) /. 
              Last@
               Quiet@
                FindMinimum[
                 SignedRegionDistance[#, a + c (b - a)], {c, 1/2}, 
                 Method -> "PrincipalAxis"]]] &,
          VertexList[#]]] &},
   {VertexList[g], 
       FindVertexColoring[g, 
        Lighter@Take[ColorData[97, "ColorList"], 2]]} //
      Transpose // Map[Apply@Style] //
    Show[
      Graphics[{#, 
        MeshPrimitives[
         DiscretizeRegion[
          RegionIntersection[basereg, RegionUnion@lines], bbox, 
          MaxCellMeasure -> 1/10000, MeshQualityGoal -> "Maximal"], 
         1]}], g] &]]]
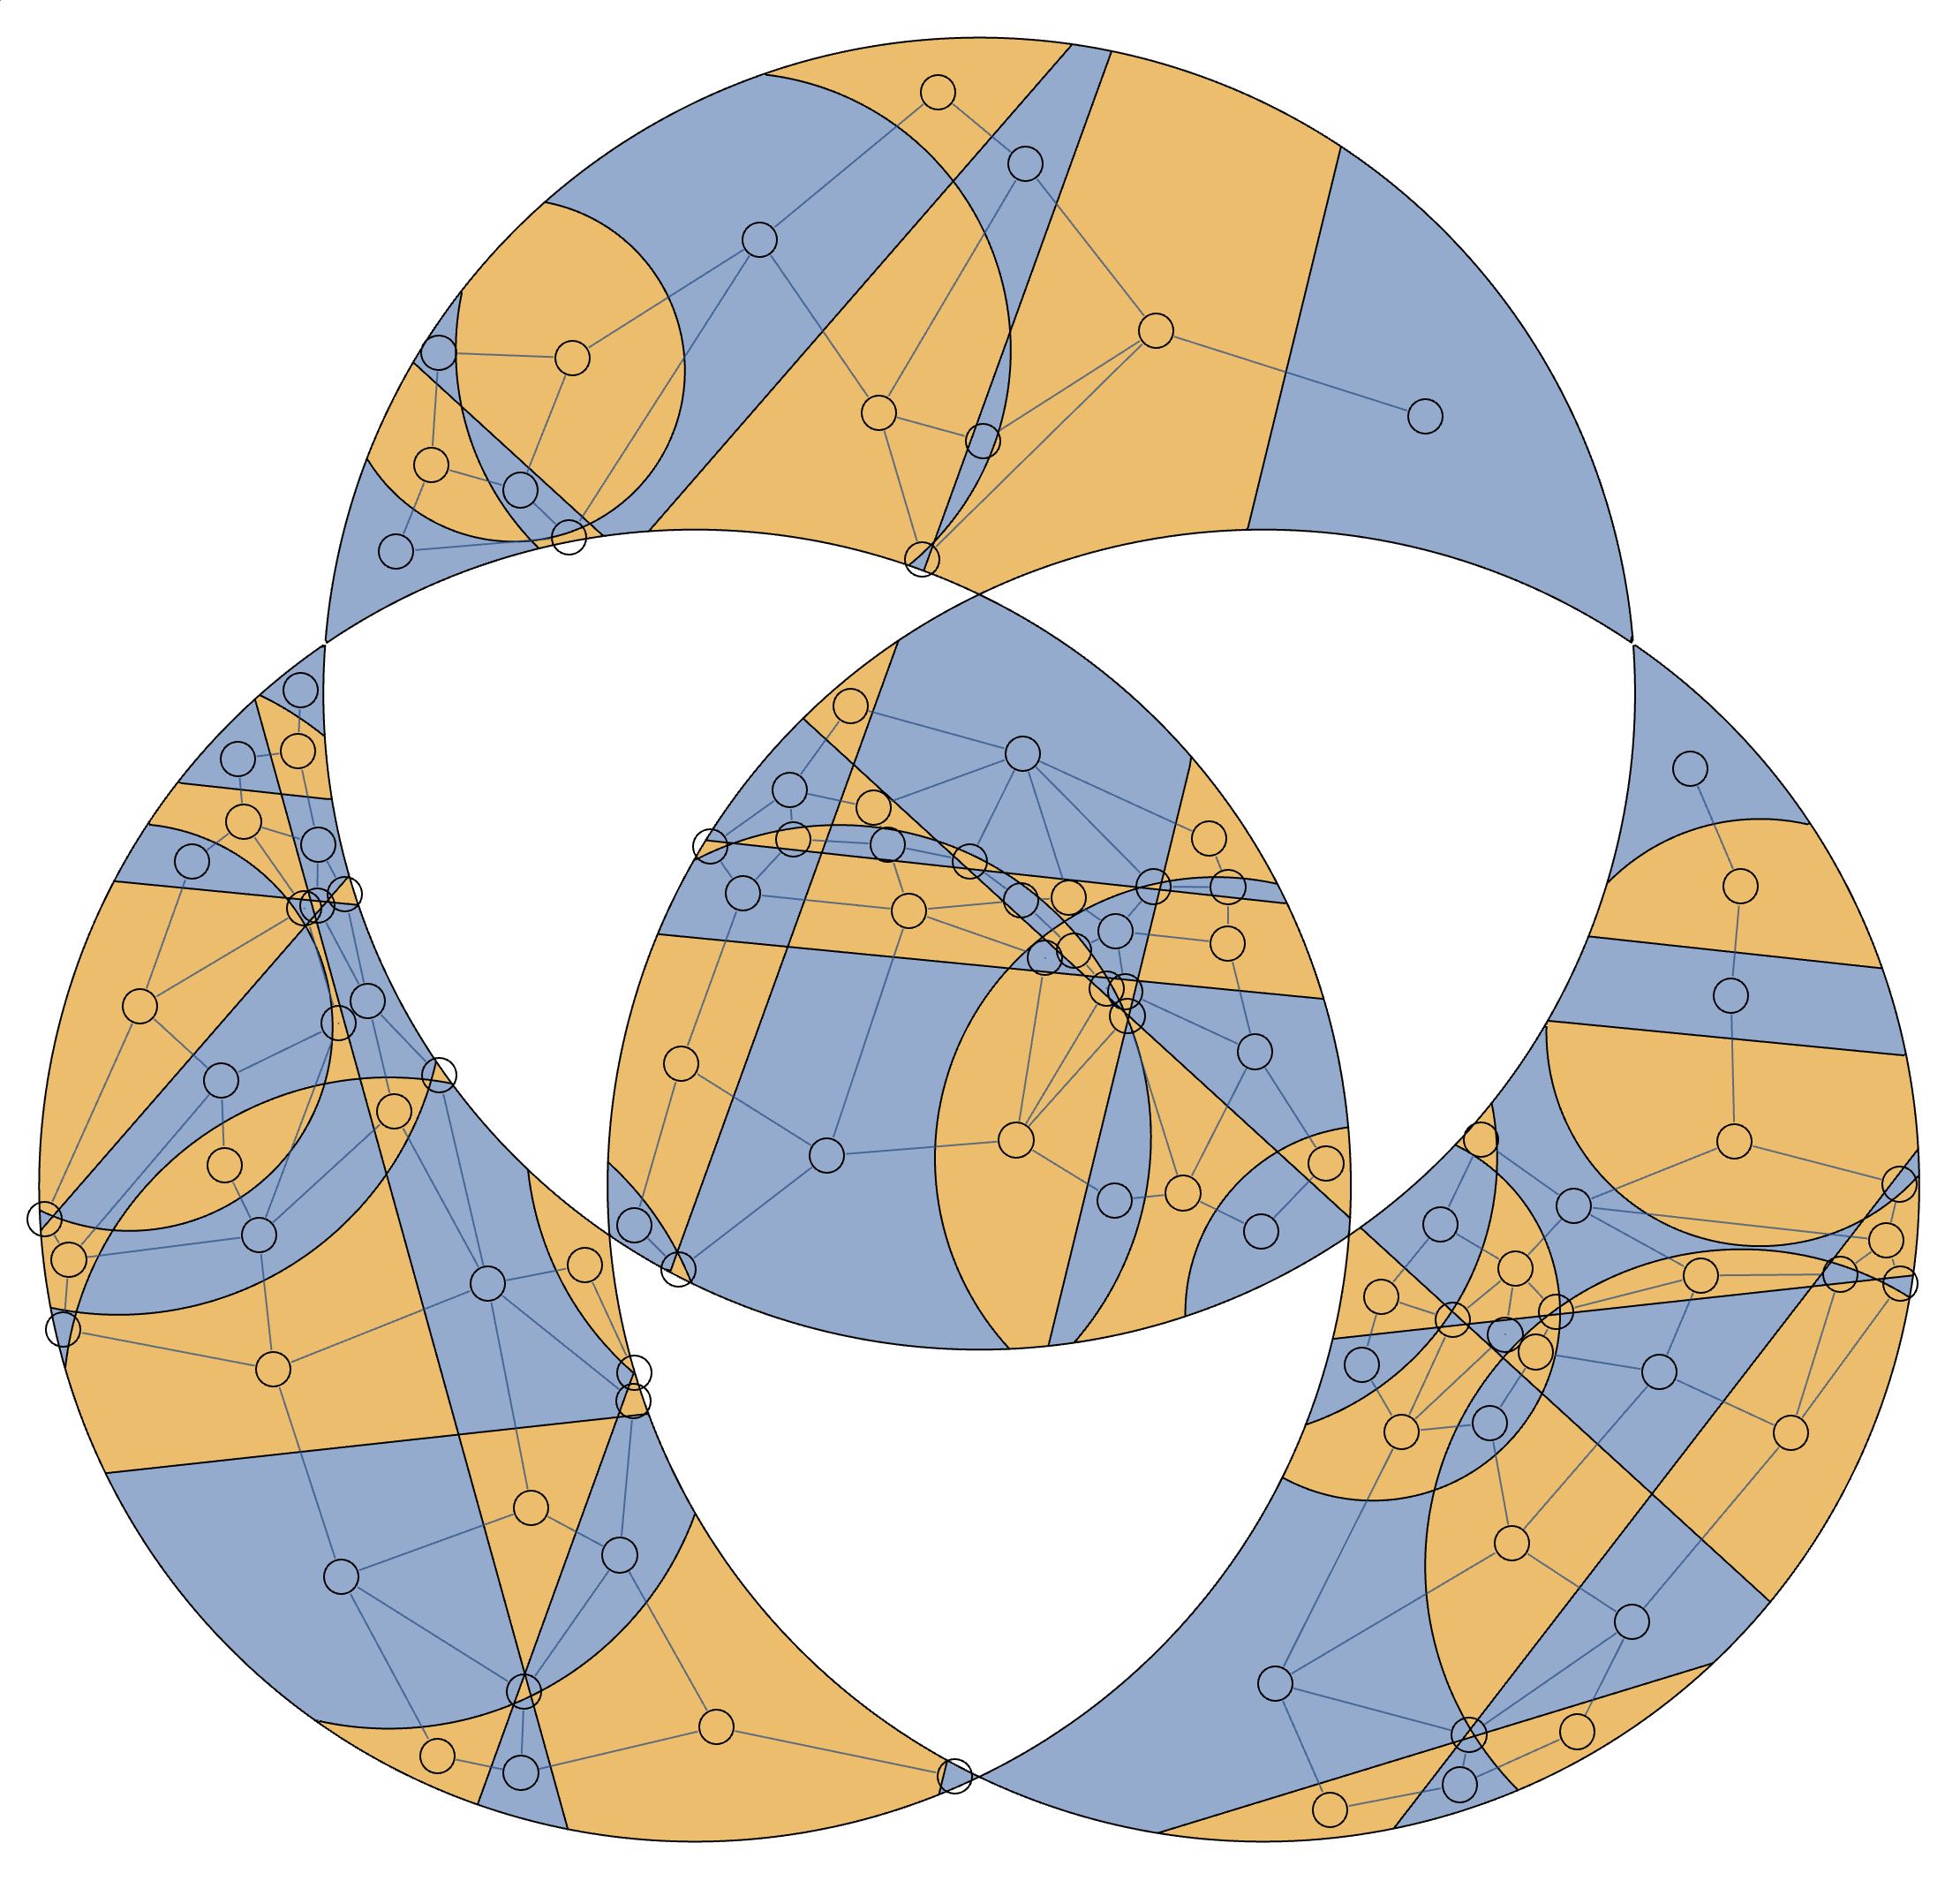
enter image description here

Just to prove that this also applies to a general-purpose colouring solution, use parameters below (produce a four-colouring):

$$\cdots$$

With[{basereg = Disk[]},
 With[{
   lines = {Circle[], Circle[{0, 0}, 2/3],
     Sequence @@ Table[
       Line[
        Rationalize[# {Sin@a, Cos@a} & /@ {1.9999/3, 1.0001}, 
         1/10000]],
       {a, 0, 5 Pi/3, 2 Pi/3}]},
   bbox = RegionBounds@basereg},

$$\cdots$$

{VertexList[g], 
  FindVertexColoring[g, Lighter@Take[ColorData[97, "ColorList"], 4]]}  //

$$\cdots$$
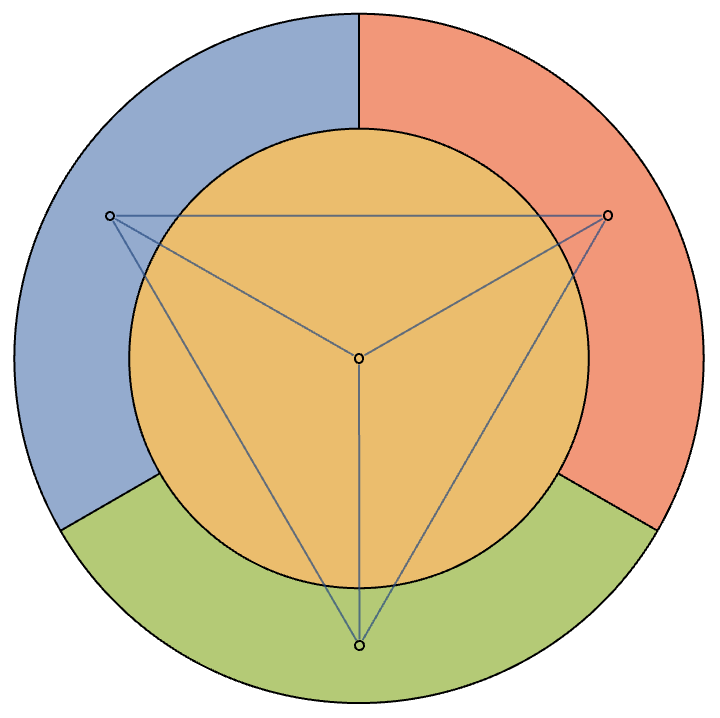
enter image description here

$\endgroup$
3
  • $\begingroup$ Hello, I tried using this cylindrical decomposition to find squares in a finite grid in this question but it gave the error shown in the edit of that question. This method did not really answer that question as it seems this method relies on the presence of infinite lines for RegionDifference to find the region between the lines as a boolean region but I could use it in another scenario where the grid is more regular. $\endgroup$ Commented Nov 1, 2022 at 19:12
  • $\begingroup$ @userrandrand Based on your question edits, I assume you got the error message sorted out? If I understood correctly rationalisation of coordinated did the trick for you. It may be that topological operations with CylindricalDecompose don't give the most helpful error messages. Nonetheless, CylindricalDecompose should be given only equations with exact coefficients (which is accomplished with Rationalize[..., 0]. $\endgroup$
    – kirma
    Commented Nov 2, 2022 at 4:40
  • 1
    $\begingroup$ Hi sorry yes I forgot to delete this comment. Thanks (:. $\endgroup$ Commented Nov 2, 2022 at 5:12
15
$\begingroup$

Edit

  • Combine several methods which from

WindingCount

RegionUnion

VertexCoordinates

Clear["Global`*"];
graphics = 
  Graphics[
   Table[{Hue[RandomReal[]], Opacity[0.8], 
     InfiniteLine[RandomReal[{-1, 1}, {2, 2}]]}, {49}], 
   PlotRange -> {{-1, 1}, {-1, 1}}, Frame -> True];
mesh = DiscretizeGraphics[graphics];
lines = MeshPrimitives[mesh, 1];
reg = Join[
    MeshPrimitives[
     BoundaryDiscretizeGraphics[Rectangle[{-1, -1}, {1, 1}]], 1], 
    lines] // RegionUnion;
g = Graph[MeshPrimitives[reg, 1] /. Line -> Apply@UndirectedEdge, 
   VertexCoordinates -> MeshCoordinates[reg]];
faces = PlanarFaceList[g];
faces = Select[faces, WindingCount[Line@#, Mean@#] == 1 &];
Graphics[{{RandomColor[], Polygon@#} & /@ faces}]

enter image description here

  • We also add the DualPlanarGraph.
Clear["Global`*"];
SeedRandom[123];
lines = Table[{Hue[RandomReal[]], Opacity[0.8], 
    InfiniteLine[RandomReal[{-1, 1}, {2, 2}]]}, {49}];
graphics = Graphics[lines, PlotRange -> {{-1, 1}, {-1, 1}}];
mesh = DiscretizeGraphics[graphics];
lines = MeshPrimitives[mesh, 1];
reg = Join[
    MeshPrimitives[
     BoundaryDiscretizeGraphics[Rectangle[{-1, -1}, {1, 1}]], 1], 
    lines] // RegionUnion;
g = Graph[MeshPrimitives[reg, 1] /. Line -> Apply@UndirectedEdge, 
   VertexCoordinates -> MeshCoordinates[reg]];
faces = PlanarFaceList[g];
index = FirstPosition[WindingCount[Line@#, Mean@#] & /@ faces, -1];
faces2 = Delete[faces, index // First];
graphics2 = Graphics[{{RandomColor[], Polygon@#} & /@ faces2}];
dual = Graph[VertexList@DualPlanarGraph[g], 
   EdgeList@DualPlanarGraph[g], 
   VertexCoordinates -> RegionCentroid@*Polygon /@ faces, 
   EdgeStyle -> White, VertexStyle -> White, 
   VertexSize -> 12];
dual2 = VertexDelete[dual, VertexList[dual][[First@index]]];
Show[graphics2, dual2]

enter image description here

  • Use ImageMesh.
lines = Graphics[{AbsoluteThickness[.5], 
    Table[{InfiniteLine[RandomReal[{-1, 1}, {2, 2}]]}, {49}]}, 
   PlotRange -> {{-1, 1}, {-1, 1}}, Frame -> False];
regs = ConnectedMeshComponents[
   ImageMesh[lines, Method -> "MarchingSquares"]];
MapIndexed[{{EdgeForm[ColorData[97] @@ #2], 
     FaceForm[ColorData[97] @@ #2], #1}} &, regs] // Graphics

{color = RandomColor[], FaceForm[color], EdgeForm[color], #} & /@ 
  regs // Graphics

(*MapIndexed[{{ColorData[97] @@ #2, #1}, 
    Text[ToString @@ #2, RegionCentroid@#1]} &, regs] // Graphics *)

enter image description here

enter image description here

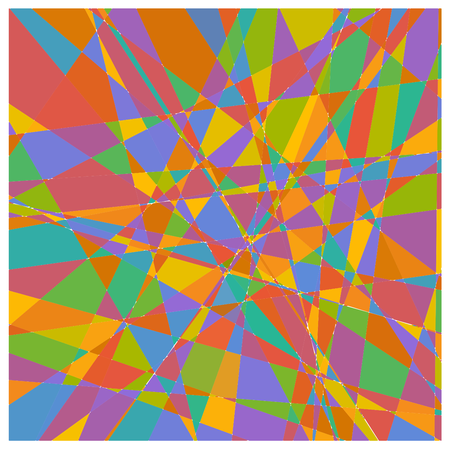
  • RegionSymmetricDifference

Thanks at @kirma some hints about another way.

Fold[RegionSymmetricDifference, 
 Table[RegionIntersection[Rectangle[{-1, -1}, {1, 1}], 
   HalfSpace[RandomReal[{-1, 1}, 2], RandomPoint@Circle[]]], {50}]]

enter image description here

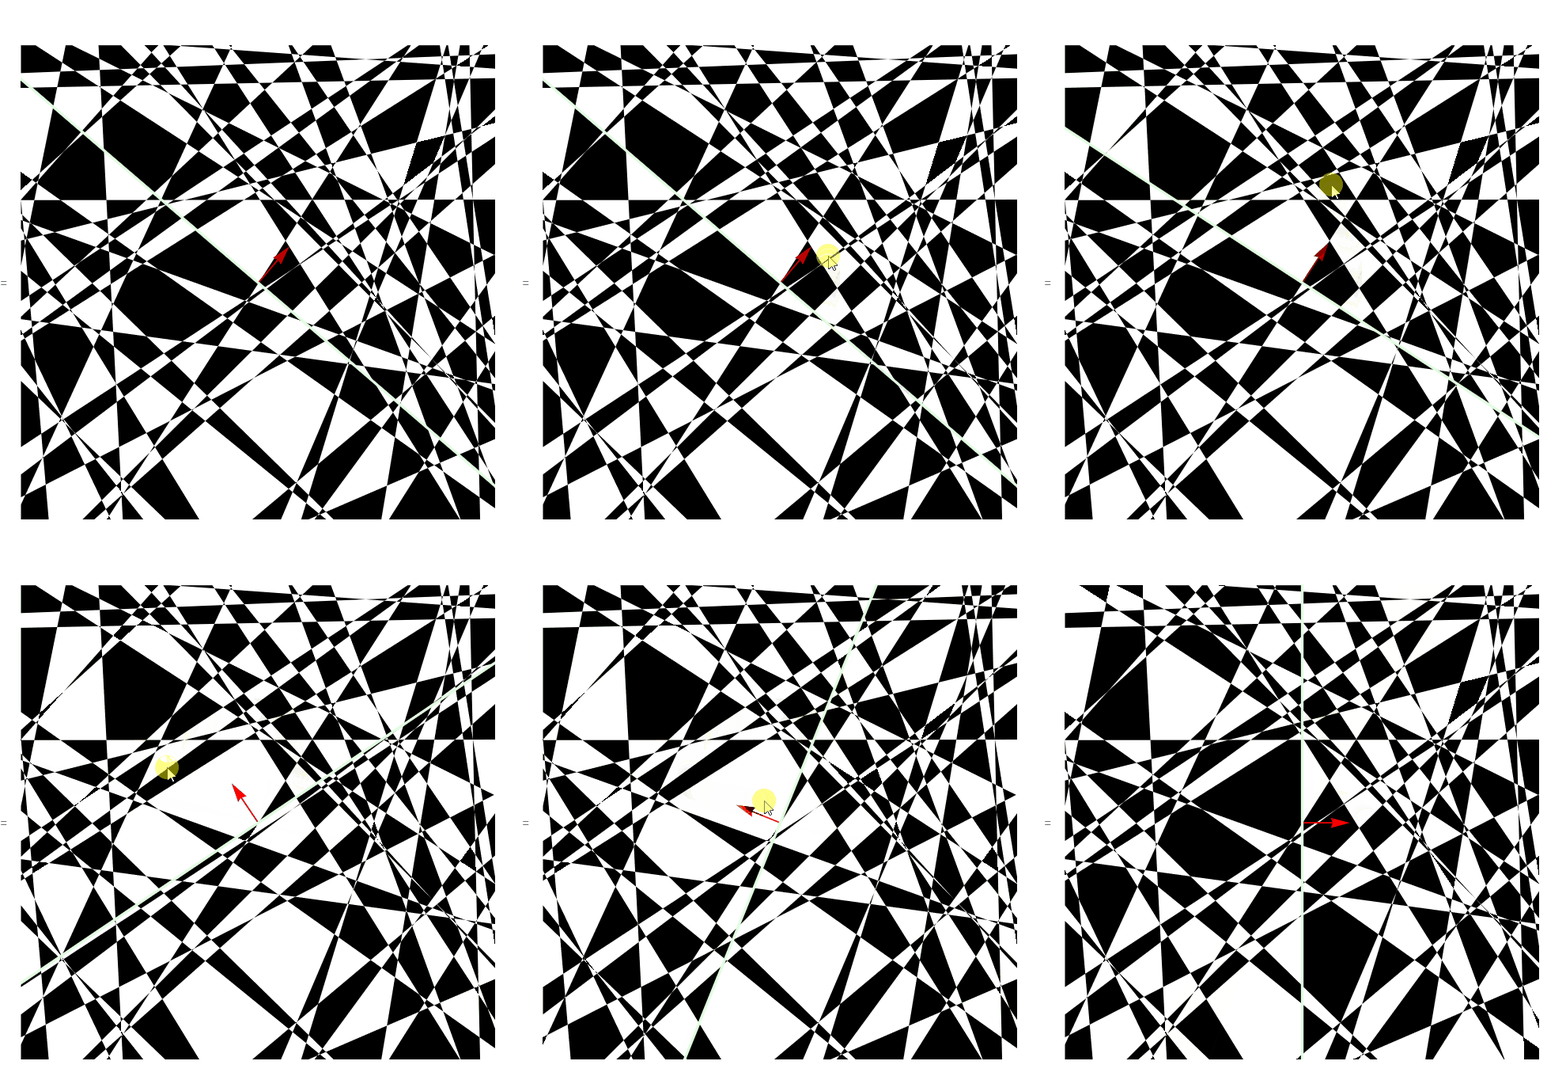
  • Animation
reg = Fold[RegionSymmetricDifference, 
   Table[RegionIntersection[Rectangle[{-1, -1}, {1, 1}], 
     HalfSpace[RandomReal[{-1, 1}, 2], RandomPoint@Circle[]]], {50}]];
DynamicModule[{n = {1, 1}},
 LocatorPane[Dynamic@n, 
  Dynamic@Graphics[{RegionSymmetricDifference[reg, 
      RegionIntersection[Rectangle[{-1, -1}, {1, 1}], 
       HalfSpace[n, {0, 0}]]], {AbsolutePointSize[10], Red, 
      Dynamic[Arrow[{{0, 0}, .2 n/Norm[n]}]]}, LightGreen, Thick, 
     InfiniteLine[{{0, 0}, Cross@n}]}, PlotRange -> 1], 
  Appearance -> None]]

enter image description here

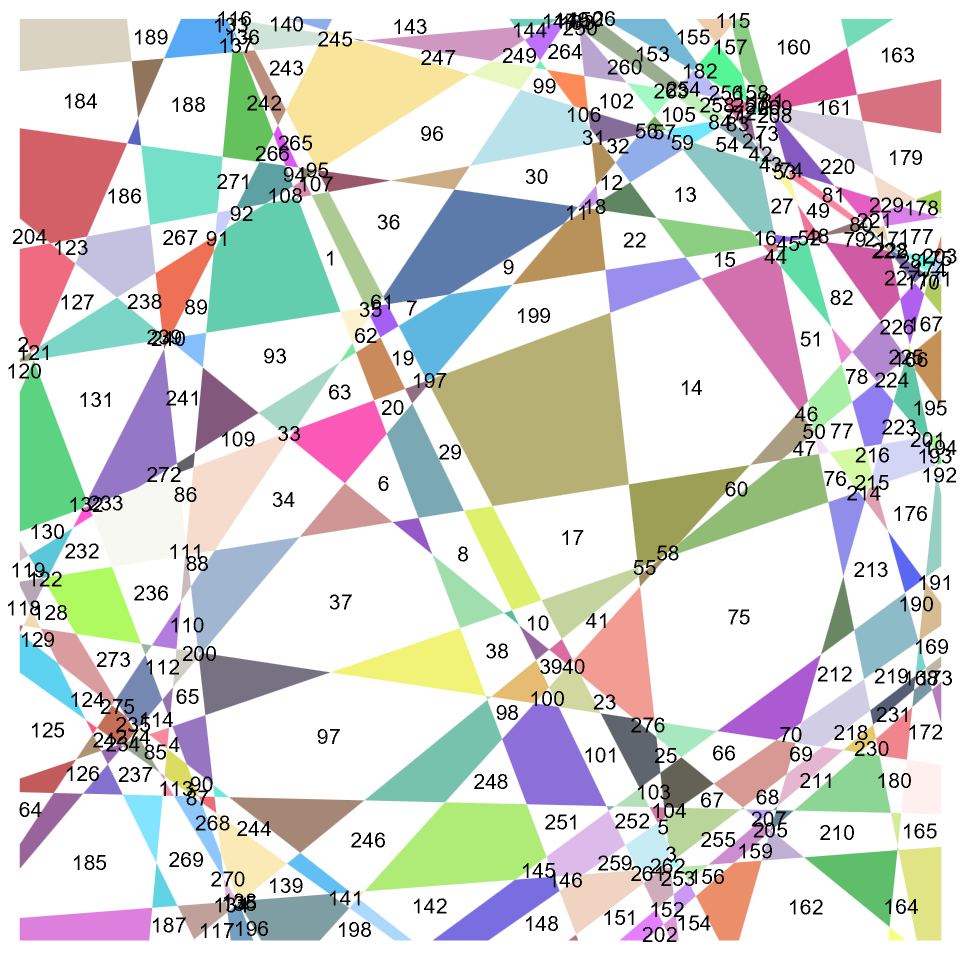
  • Use PolygonDecomposition.
Clear["Global`*"];
SeedRandom[1];
rega = Fold[RegionSymmetricDifference, 
   Table[RegionIntersection[Rectangle[{-1, -1}, {1, 1}], 
     HalfSpace[RandomReal[{-1, 1}, 2], RandomPoint@Circle[]]], {49}]];
regb = RegionDifference[Rectangle[{-1, -1}, {1, 1}], rega];
regadecom = PolygonDecomposition[rega, "Convex"];
regbdecom = PolygonDecomposition[regb, "Convex"];
Graphics[{{{Lighter@RandomColor[], #} & /@ 
    regadecom}, {MapIndexed[{Text[Style[ToString @@ #2, 8], 
       RegionCentroid@#1]} &, regbdecom]}}]

enter image description here

  • Use even-odd filling rule.

I want to find a faster way to generate the 2-colors region for large amount of lines(for example 400 lines),up to today only a part of work accomplish since some bugs need to be fixed.

enter image description here

$\endgroup$
5
  • $\begingroup$ If I understand correctly, the (vector) image containing the random lines is rasterized first, the result is then subject to connected component analysis. Due to the finite resolution introduced by the rasterization, the approach only works for a few lines--unless the image is made huge? $\endgroup$
    – Taozi
    Commented Apr 22, 2022 at 1:20
  • $\begingroup$ @Taozi You are right. We can adjust the AbsoluteThickness[1] to make the lines thin and then we can seperate the regions although there many lines. $\endgroup$
    – cvgmt
    Commented Apr 22, 2022 at 1:38
  • 1
    $\begingroup$ For images you can do two-colour plot like this: Fold[ImageDifference, ParallelTable[RegionImage[HalfSpace[RandomReal[{-1, 1}, 2], RandomPoint@Circle[]], {{-1, 1}, {-1, 1}}], {100}]] $\endgroup$
    – kirma
    Commented Apr 26, 2022 at 15:36
  • $\begingroup$ @kirma Thanks your code. $\endgroup$
    – cvgmt
    Commented Apr 26, 2022 at 22:42
  • $\begingroup$ PolygonDecomposition seems like a hidden gem similarly to CylindricalDecomposition with the somewhat recently introduced topological operations. Too bad it doesn't extend to higher dimensions though... $\endgroup$
    – kirma
    Commented May 3, 2022 at 19:30
11
$\begingroup$

Another approach:

m = Graphics[
  Table[{Hue[RandomReal[]], Opacity[0.8], 
    InfiniteLine[RandomReal[{-1, 1}, {2, 2}]]}, {49}], 
  PlotRange -> {{-1, 1}, {-1, 1}}, Frame -> True]

enter image description here

Discretize it first:

mesh = DiscretizeGraphics[m];

Get internal lines and lines that defined boundaries:

blines = 
  Line[Tuples[
     RegionBounds[
      mesh]][[FindShortestTour[Tuples[RegionBounds[mesh]]][[2]]]]];
lines = MeshPrimitives[mesh, 1];

Split lines:

res = Region`Mesh`SplitIntersectingSegments[{lines, blines}];
segments = 
  DeleteDuplicates[
   Sort /@ Flatten[Map[Partition[#, 2, 1] &, res[[2]]], 1]];
coords = res[[1]];

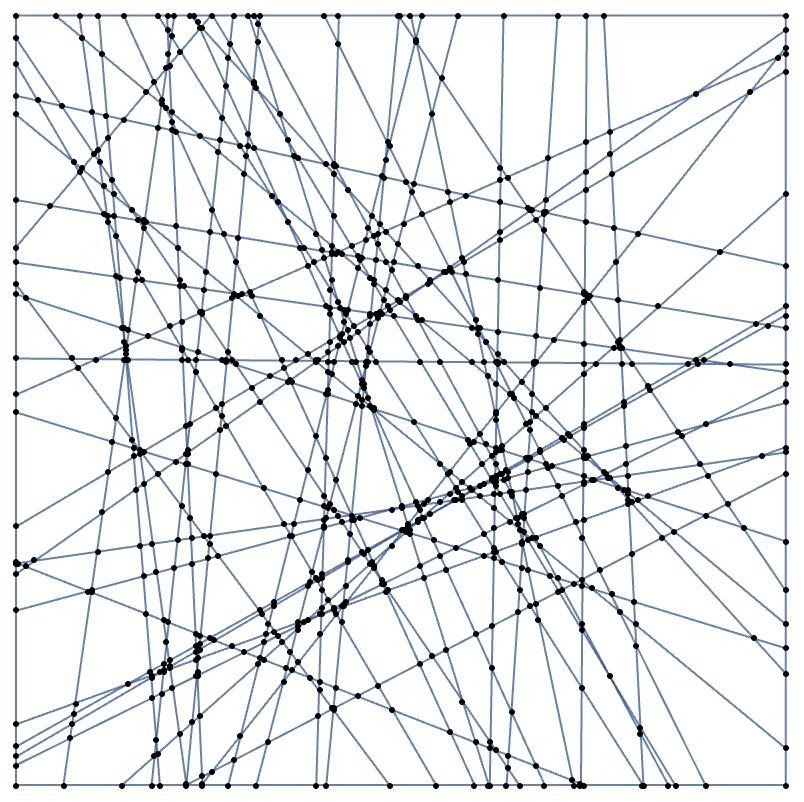
Construct planar graphs:

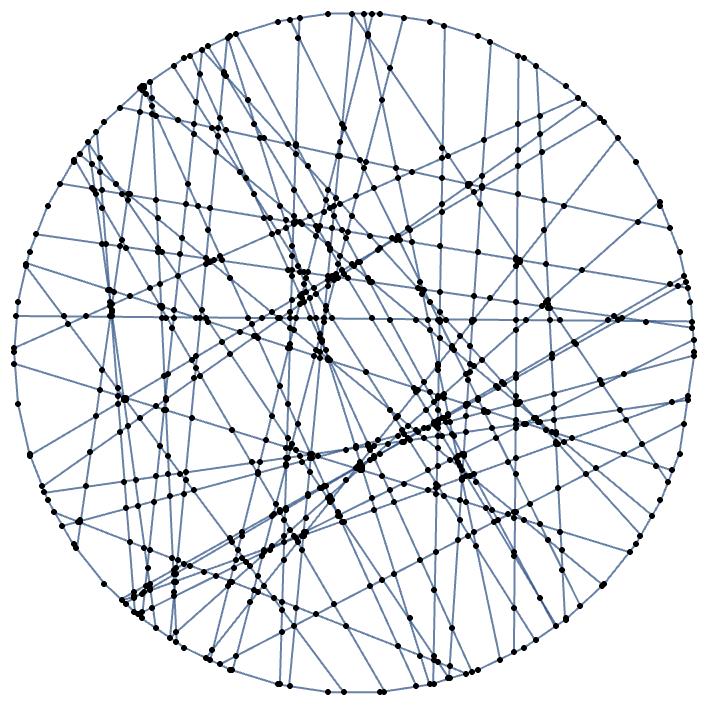
g = Graph[Range[Length[coords]], UndirectedEdge @@@ segments, 
  VertexCoordinates -> coords, VertexStyle -> Black, 
  VertexShapeFunction -> "Point", VertexSize -> Tiny]

enter image description here

Find planar faces (need to filter out the outer face):

faces = DeleteCases[PlanarFaceList[g], 
   x_ /; NegativelyOrientedPoints[coords[[x[[;; 3]]]]], 1];

Length[faces]

873

Show[{Graphics[
   GraphicsComplex[
    coords, {Opacity[.7], 
     Thread[{RandomColor[Length[faces]], Polygon /@ faces}]}], 
   PlotRange -> {{-1, 1}, {-1, 1}}], m}]

enter image description here

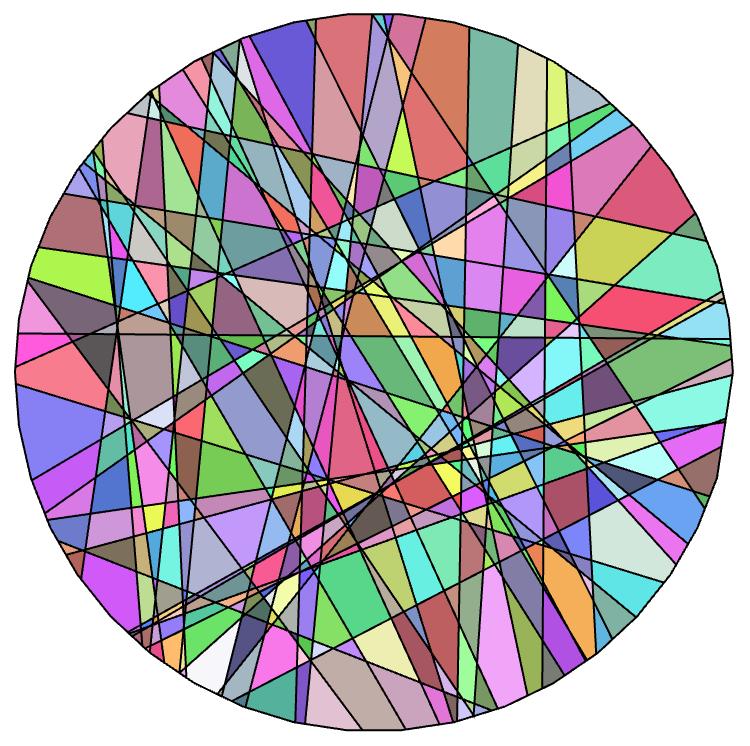
To split other shapes like a disk:

Show[{Graphics[Disk[]], m}]

enter image description here

disk = BoundaryDiscretizeGraphics[Disk[]];
blines = MeshPrimitives[disk, 1];
res = Region`Mesh`SplitIntersectingSegments[{lines, blines}];

segments = 
  DeleteDuplicates[
   Sort /@ Flatten[Map[Partition[#, 2, 1] &, res[[2]]], 1]];
coords = res[[1]];

mf = RegionMember[disk];
segments = Select[segments, (And @@ mf[coords[[#]]]) &];

g = IndexGraph@First[
  ConnectedGraphComponents@
   Graph[Range[Length[coords]], UndirectedEdge @@@ segments, 
    VertexCoordinates -> coords, VertexStyle -> Black, 
    VertexShapeFunction -> "Point", VertexSize -> Tiny]]

enter image description here

coords = GraphEmbedding[g];
faces = PlanarFaceList[g];
max = Max[Length /@ faces];
faces = Select[PlanarFaceList[g], (Length[#] != max) &];

Graphics[
 GraphicsComplex[
  coords, {EdgeForm[Black], Opacity[.7], 
   Thread[{RandomColor[Length[faces]], Polygon /@ faces}]}]]

enter image description here

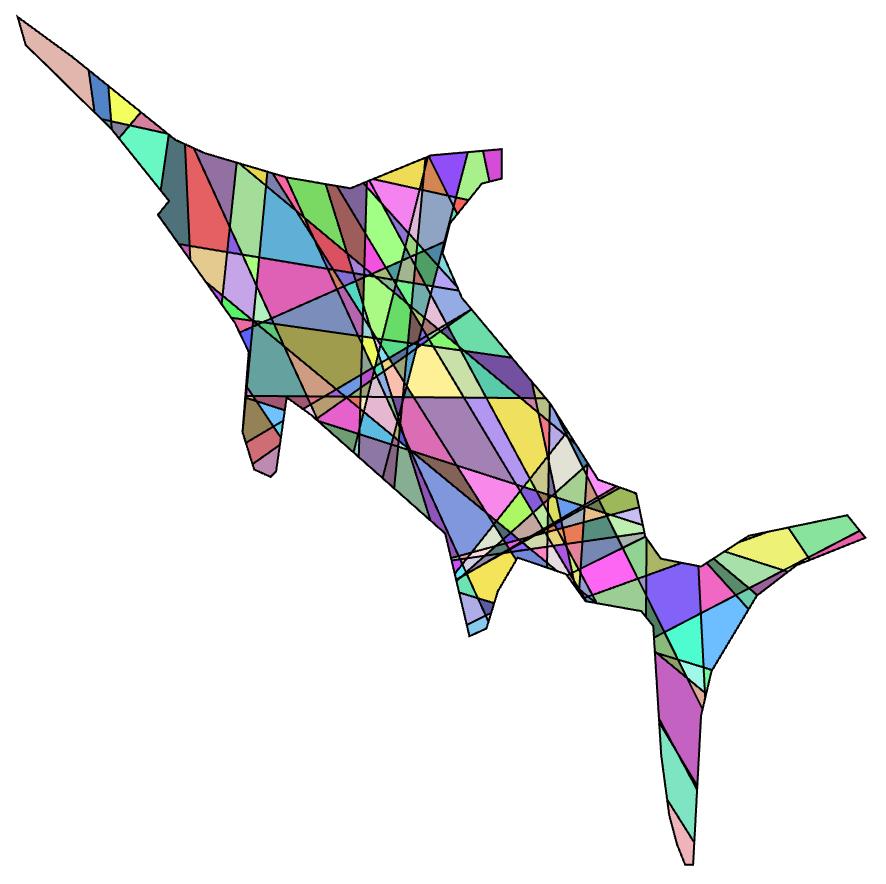
Another shape example:

enter image description here

Graphics[
 GraphicsComplex[
  coords, {EdgeForm[Black], Opacity[.7], 
   Thread[{RandomColor[Length[faces]], Polygon /@ faces}]}]]

enter image description here

$\endgroup$
5
  • $\begingroup$ Very nice! Do you know if there's any documentation on Region`Mesh`SplitIntersectingSegments? I can't seem to find any and it sounds like a very useful function. $\endgroup$ Commented Apr 22, 2022 at 20:15
  • $\begingroup$ @AccidentalTaylorExpansion no it's a undocumented function. $\endgroup$
    – halmir
    Commented Apr 22, 2022 at 20:23
  • $\begingroup$ Ah that's too bad, how can you know about these types of functions? $\endgroup$ Commented Apr 22, 2022 at 20:24
  • 3
    $\begingroup$ @AccidentalTaylorExpansion well.. something like this Names["Region`Mesh`*Intersect*"] $\endgroup$
    – halmir
    Commented Apr 22, 2022 at 20:28
  • $\begingroup$ (+1) This method is powerful! $\endgroup$
    – cvgmt
    Commented Apr 24, 2022 at 9:49
8
$\begingroup$

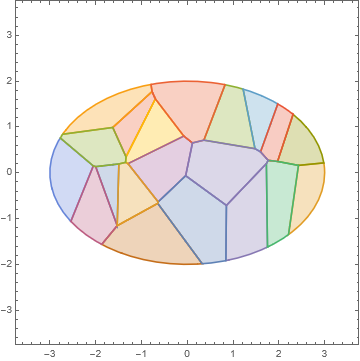
The following is a bit of a shot in the dark, since I am not sure that I understand what format you would like as output. But it's pretty :-)

region = Disk[{0, 0}, {3, 2}];
mesh = VoronoiMesh@RandomPoint[region, 20];
primitives = MeshPrimitives[mesh, 2];
cellsWithin = RegionIntersection[#, region] & /@ primitives;

RegionPlot[
  Evaluate@cellsWithin,
  PlotRange -> {-3, 3}, PlotRangePadding -> Scaled[0.1]
]

ellipse tessellated in color

cellsWithin is a list of BooleanRegions that represent the single cells into which your region has been "partitioned".

With thanks to @Kuba who provided the inspiration code.

$\endgroup$
3
  • $\begingroup$ Thank you for your input. However, your method is based on the Voronoi partition of n given random points, which differs from the posted problem. For example, many lines in your figure fail to cut regions along their direction. $\endgroup$
    – Taozi
    Commented Apr 22, 2022 at 1:17
  • $\begingroup$ @Taozi That's true. However I think it would help if you specified in your question in what format you would like to obtain your results. $\endgroup$
    – MarcoB
    Commented Apr 22, 2022 at 1:55
  • $\begingroup$ I think a list of regions should work. This format is easy for visualization and analysis. Now it seems to me that the only way is to start with a list containing the original shape, then iteratively partition the regions in the list. I don't know how to code this, but as the length of the list grows with time, I guess it won't be extremely efficient when there are many lines. I cannot think of smart ways. $\endgroup$
    – Taozi
    Commented Apr 22, 2022 at 2:04
5
$\begingroup$

This is the best I could come up with. As input I expect a list of 'lines' where a line is a list of the form {{x1, y1}, {x2, y2}}. The output is a list of all the different regions where a region is something that is accepted by the Region[] object. The algorithm works by keeping a list of regions. It then loops of over all lines and for each line it loops over all regions and splits them in two. It then adds those new pieces to the region list (discarding the old ones).

First define the following function

getRegions[startingRegion_, lines_] := 
 Module[{regions, tempRegions, region1, region2},
  regions = {startingRegion};
  Do[
   tempRegions = regions;
   regions = {};
   Do[
    region1 = 
     RegionIntersection[HalfPlane[line, Cross[line[[1]] - line[[2]]]],
       region];
    region2 = 
     RegionIntersection[
      HalfPlane[line, -Cross[line[[1]] - line[[2]]]], region];
    If[! (region1 === EmptyRegion[2]), AppendTo[regions, region1]];
    If[! (region2 === EmptyRegion[2]), AppendTo[regions, region2]];
    , {region, tempRegions}]
   , {line, lines}];
  regions
  ]

Then evaluate the following

window = Rectangle[{-1, -1}, {1, 1}];
nlines = 3;
linePts = RandomReal[{-1, 1}, {nlines, 2, 2}];
regions = getRegions[window, linePts];

Show @@ (RegionPlot[#, PlotRange -> 1, 
     PlotStyle -> {Hue[RandomReal[]], Opacity[.4]}] & /@ regions)
RegionPlot[#, PlotRange -> 1, 
   PlotStyle -> {Hue[RandomReal[]], Opacity[.4]}] & /@ regions

which gives

enter image description here enter image description here

Note that for nlines = 30 it already takes about 16 seconds to evaluate so be careful with large numbers.

$\endgroup$
3
  • $\begingroup$ I think this is sort of a equivalent to the CylindricalDecomposition[..., "Components"] in my answer. With it you don't need to implement your own algorithm... $\endgroup$
    – kirma
    Commented Apr 22, 2022 at 19:26
  • $\begingroup$ @kirma Yes it's quite a bit faster than my answer. Using built-in function is generally good idea if you know about them. $\endgroup$ Commented Apr 22, 2022 at 20:22
  • $\begingroup$ I believe CylindricalDecomposition/GroebnerBasis functions are/were quite a pride of WRI at some point. Of course the point here is that it doesn't work just with linear inequalities but with semialgebraic sets in general. (Thus you can find exact solutions also with disks etc., without uncertainty.) "Components" (and other operation forms) is somewhat recent development, and in my opinion should have more visibility. $\endgroup$
    – kirma
    Commented Apr 22, 2022 at 20:38

Your Answer

By clicking “Post Your Answer”, you agree to our terms of service and acknowledge you have read our privacy policy.

Not the answer you're looking for? Browse other questions tagged or ask your own question.