19
$\begingroup$

I'm trying to label a bar chart with rotated labels

see this simple example:

BarChart[RandomReal[1, 10], BarSpacing -> Large, 
 ChartLabels -> 
  Placed[ToString /@ RandomReal[100000, 10], Axis, Rotate[#, Pi/4] &]]

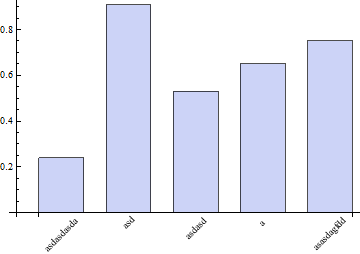
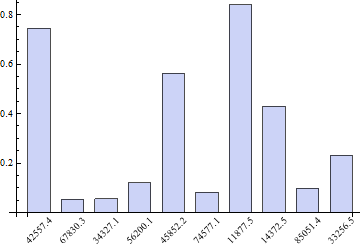
In this case the center of the label is aligned with the center of the bar.

Mathematica graphics

I want the right/top of the label to be aligned with the center of the bar instead, basically shift the labels over a bit to the left. How can this be done?

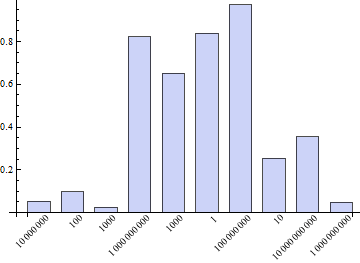
Also, what if all the labels have different lengths:

Mathematica graphics

$\endgroup$
2
  • $\begingroup$ You could try including an AdjustmentBox in your Placed function. I haven't time to write this up as a full answer just now but someone else might like to try. $\endgroup$
    – Verbeia
    Commented Mar 6, 2012 at 22:08
  • 1
    $\begingroup$ s0rce, you may wish to revisit this question. belisarius's method no longer works in version 10, while Brett's does, and also for other plots as well. $\endgroup$
    – Mr.Wizard
    Commented Nov 11, 2014 at 2:57

5 Answers 5

24
$\begingroup$

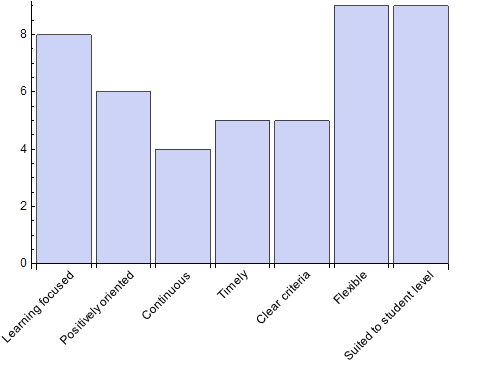
By default the Axis position that you're using centers the label under the bar along the axis. For long text that's rotated at a slant, it generally looks bad. (It works fine for horizontal and vertical text, however.)


Here's one approach, using a different second argument for Placed:

Module[{
    labels = {"Learning focused", "Positively oriented", "Continuous", 
              "Timely", "Clear criteria", "Flexible", "Suited to student level"}, 
    data = {8, 6, 4, 5, 5, 9, 9}
    }, 
    BarChart[data, 
        ChartLabels -> Placed[
            labels, 
            {{0.5, 0}, {0.9, 1}}, 
            Rotate[#, (2/7) Pi] &
            ], 
        PlotRange -> {Automatic, {0, 10}}, Ticks -> {None, Range[0, 10, 2]}, 
        ImagePadding -> {{20, 0}, {95, 0}}
    ]
]
enter image description here

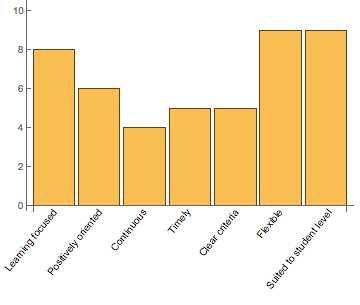
The first part of the argument, {0.5, 0}, says to place the label halfway across the bar, at the bottom.

The second part of the argument, {0.9, 1}, says what part of the label at the first part. In this case it's near, but not quite at, the right-top corner.

It's not exactly at the corner, because I think it looks better if the top of the "ink" is centered below the bars, and that won't be the actual corner unless your label ends with ">" or something similar.


Here's a second approach, using a different third argument of Placed:

Module[{
    labels = {"Learning focused", "Positively oriented", "Continuous", 
              "Timely", "Clear criteria", "Flexible", "Suited to student level"}, 
    data = {8, 6, 4, 5, 5, 9, 9}
    }, 
    BarChart[data, 
        ChartLabels -> Placed[
            labels, 
            Axis, 
            Block[{text = Rotate[#, (2/7) Pi]}, 
                Row[{text, Invisible[text]}, 
                    "\[NegativeMediumSpace]"]
            ]&
            ], 
        PlotRange -> {Automatic, {0, 10}}, Ticks -> {None, Range[0, 10, 2]}, 
        ImagePadding -> {{20, 0}, {95, 0}}
    ]
]

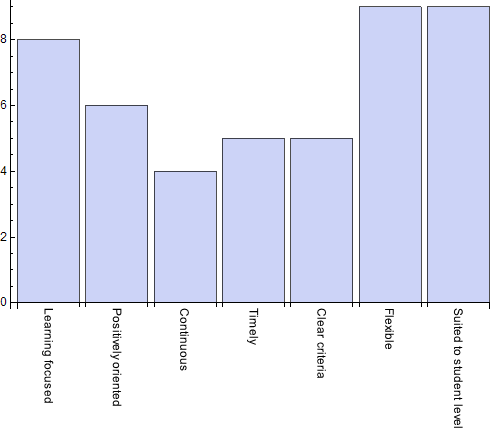
This uses the normal axes positioning, but for each label, it creates an object that has the label and an invisible copy of the label side-by-side so that the center of the object is the end of the visible label. (I used a negative space between the objects, because again I think it looks better.) The nice thing about this approach is that the basic idea can be used for labels for ticks on axes that don't otherwise allow specific placements.

enter image description here

$\endgroup$
2
  • $\begingroup$ Much more elegant than my version, +1! My function was built to be used with FrameTicks, not Placed, so I didn't have these options. $\endgroup$
    – Verbeia
    Commented Oct 16, 2014 at 4:10
  • 2
    $\begingroup$ @Verbeia The second approach should also work with frame ticks. $\endgroup$ Commented Oct 16, 2014 at 15:47
12
$\begingroup$

It can be done using the pos parameter of Placed:

BarChart[RandomReal[1, 10], BarSpacing -> Large, 
 ChartLabels -> 
  Placed[(ToString /@ 10^RandomInteger[10, 10]), 
         {{1, 0}, {1, 1}} 
         (* pos: bar position: lower right corner (1,0), 
                 text box:     upper right corner (1,1)  *), 
         Rotate[#, Pi/4] &
  ]
]

Mathematica graphics

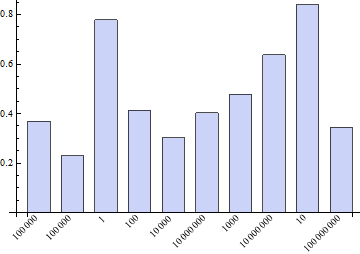
Use {0.5,0} instead of {1,0} to align with the bottom center of the bar (which I find slightly less esthetical pleasing, but YMMV):

Mathematica graphics

$\endgroup$
2
  • $\begingroup$ NIce approach. I find {0.75, 0} more pleasing to the eye than {0.5, 0}. $\endgroup$
    – DavidC
    Commented Mar 6, 2012 at 23:02
  • $\begingroup$ I also like {0.75,0} however, the labels are slightly closer to the Axis here then they are with Axis, can this be solved? edit: {{0.75, 0}, {1, 1.1}} looks a bit better but I think it makes the top uneven. $\endgroup$
    – s0rce
    Commented Mar 7, 2012 at 2:49
12
$\begingroup$

Something like this could also do:

BarChart[RandomReal[1, 10], BarSpacing -> Large, 
  ChartLabels -> 
   Placed[ToString /@ 
     RandomChoice[ExampleData[{"Text", "DeclarationOfIndependence"}, "Words"], 10], 
     Axis, Rotate[#, Pi/4] &]] /. 
 ImageScaled[{1/2, 1}] -> ImageScaled[{0.9, 1}]

enter image description here

$\endgroup$
7
  • $\begingroup$ Nice to see you at the site. Btw, I wasn't able to get your code to run (even after changing EampleData to ExampleData. $\endgroup$
    – DavidC
    Commented Mar 6, 2012 at 23:56
  • $\begingroup$ @DavidCarraher: Please try now. $\endgroup$ Commented Mar 7, 2012 at 0:07
  • $\begingroup$ It works great! $\endgroup$
    – DavidC
    Commented Mar 7, 2012 at 1:23
  • $\begingroup$ @IstvánZachar Thanks for the edit! $\endgroup$ Commented Mar 7, 2012 at 13:31
  • $\begingroup$ I'm sorry to report that this no longer works in Mathematica 10. $\endgroup$
    – Mr.Wizard
    Commented Nov 11, 2014 at 2:58
11
$\begingroup$

Here is a function I had lying around to deal with the same problem. Note you need to specify your font and size somewhere first, or your could adapt the following function to take options.

The issue is that Rotate rotates around the center of the item, not around some point corresponding to a top edge or corner. This code works out where the top corner should be, and adds margins to the box so that the top corner stays centred on the bar. Depending on where you actually want the labels to be, you might need to adapt this a little. This function was designed for the case where the labels were always at the bottom of a framed chart.

font = "Arial"; 
fsize = 12;     
rotatelabel[xlist : {(_String | _Style) ..}, rads_]/; Length[xlist]>2 := 
 With[{len = Length[xlist], cosdeg = Cos[rads]}, 
  DisplayForm@AdjustmentBox[
      Style[Rotate[#, rads, If[Sign[rads] == 1, {Left, Bottom}, {Right, Top}]], 
       FontFamily -> font, FontSize -> fsize], 
      BoxMargins -> {{If[rads < 0,  Max[0, cosdeg*(Plus @@ 
         ImageDimensions[Rasterize[Style[#, FontFamily -> font, FontSize -> fsize]]])/(fsize) 
         - 1.5 ((len-1)/len) * Abs@cosdeg], 0], 
         If[cosdeg == 0 || cosdeg == 1 || rads < 0, 0, 
          Max[0, cosdeg*(Plus @@ 
          ImageDimensions[Rasterize[Style[#, FontFamily -> font, FontSize -> fsize]]])/(fsize)     
         - 1.5 ((len-1)/len)* Abs@cosdeg]]}, {0.3, 0.25}}] & /@ xlist]

Example using your data:

BarChart[data,  TicksStyle -> Directive[FontFamily -> "Arial", FontSize -> 12], 
 ChartLabels -> Placed[rotatelabel[labels, 45 Degree], Axis],   ImageSize -> 500]

enter image description here

The function handles the opposite slant, too, if that is what is desired.

BarChart[data, TicksStyle -> Directive[FontFamily -> "Arial", FontSize -> 12], 
 ChartLabels -> Placed[rotatelabel[labels, -45 Degree], Axis], ImageSize -> 500]

enter image description here

Another example

 BarChart[data, TicksStyle -> Directive[FontFamily -> "Arial", FontSize -> 12], 
 ChartLabels -> Placed[rotatelabel[labels, -90 Degree], Axis], ImageSize -> 500]

enter image description here

$\endgroup$
8
$\begingroup$

See if this works.

b = BarChart[RandomReal[1, 10], BarSpacing -> Large, 
 ChartLabels ->  Placed[ToString /@ RandomReal[100000, 10], Axis, 
     Rotate[#, Pi/4] &]];

b /. {Text[p_, Offset[ _, pos_], is_] -> Text[p, Offset[{-10, -2}, pos], is]}

chart

I used AbsoluteOptions[b // InputForm] to inspect the code and identify the Text commands that place the chart labels. I then offset the labels leftward by 10 printer's points.

$\endgroup$

Your Answer

By clicking “Post Your Answer”, you agree to our terms of service and acknowledge you have read our privacy policy.

Not the answer you're looking for? Browse other questions tagged or ask your own question.