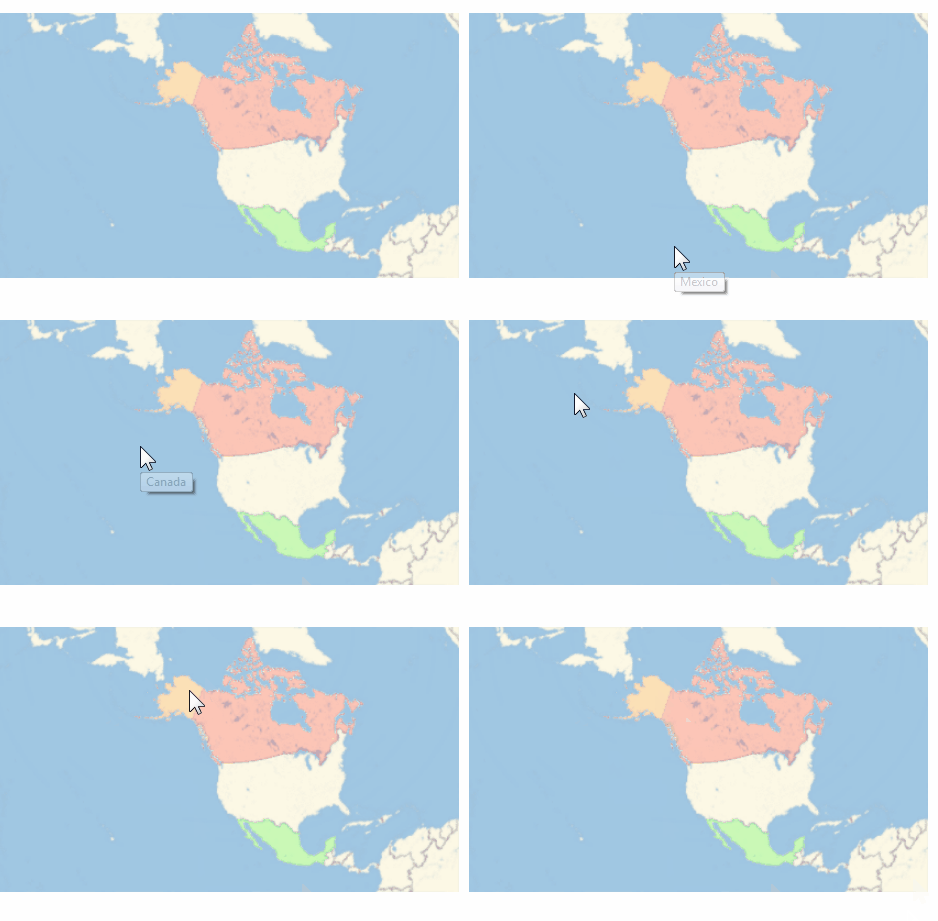
Troubleshooting: Let me rename the OP's output as testorig.
testorig =
  GeoGraphics[{Red,
    Tooltip[Entity["Country", "Canada"]["Polygon"], "Canada"], Green,
    Tooltip[Entity["Country", "Mexico"]["Polygon"], "Mexico"], Orange,
     Tooltip[
     Entity["AdministrativeDivision", {"Alaska", "UnitedStates"}][
      "Polygon"], "Alaska"]}];
Print[test];
Export["C:/testorig.html", testorig]
This generates an html file where spurious entries can be easily detected by visual inspection.
<p class="Output">
 <img src="HTMLFiles/testorig_1.gif" alt="testorig_1.gif" width="420" height="241" style="vertical-align:middle;" usemap="#map_1" />
<map name="map_1">
<area shape="rect" coords="43,100,126,39" title="Alaska" nohref="" />
<area shape="rect" coords="36,66,42,52" title="Alaska" nohref="" />
<area shape="rect" coords="151,213,242,169" title="Mexico" nohref="" />
<area shape="rect" coords="-4503599627370562,4503599627370614,4503599627370430,-4503599627370378" title="Mexico" nohref="" />
<area shape="rect" coords="111,121,267,4" title="Canada" nohref="" />
<area shape="rect" coords="-4503599627370562,4503599627370614,4503599627370430,-4503599627370378" title="Canada" nohref="" />
<area shape="rect" coords="270,237,354,188" title="Wolfram Knowledgebase with data from © OpenStreetMap contributors: http://www.openstreetmap.org/copyright" nohref="" />
</map>
</p>
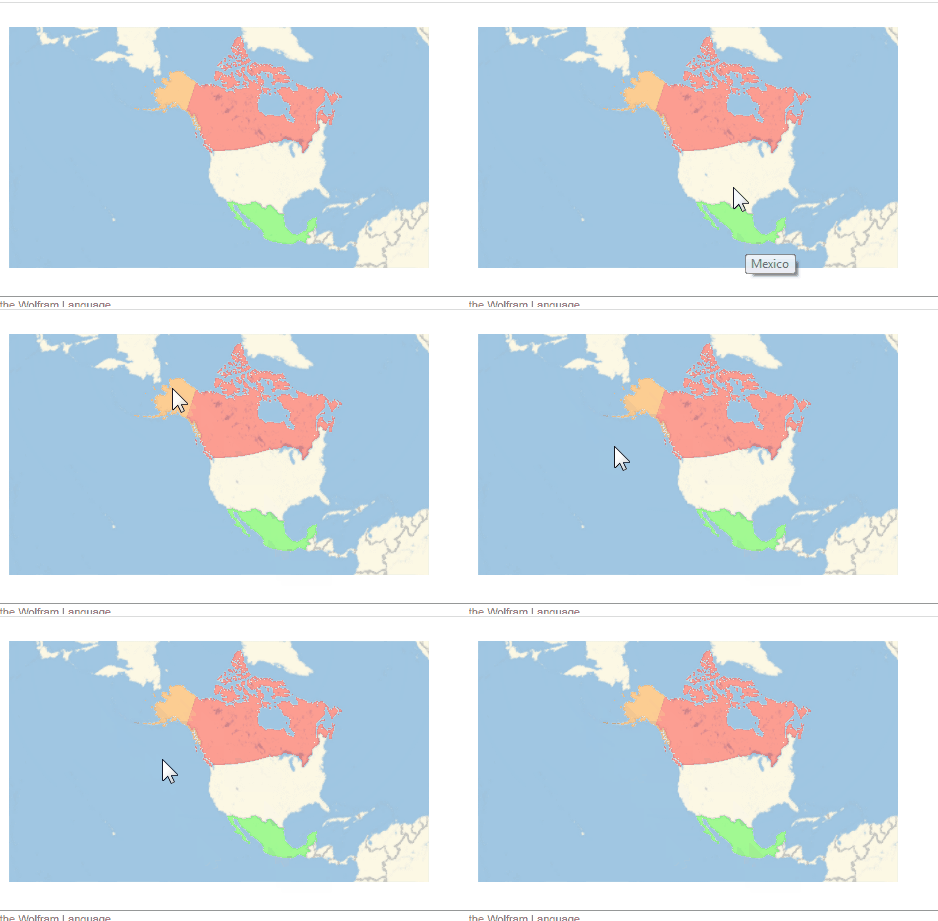
This replicates the problem, where only Mexico is being recognized by Tooltip (reason still unclear to me) Deleting these entries in the html manually leaves us with:
<p class="Output">
 <img src="HTMLFiles/testorig_1.gif" alt="testorig_1.gif" width="420" height="241" style="vertical-align:middle;" usemap="#map_1" />
<map name="map_1">
<area shape="rect" coords="43,100,126,39" title="Alaska" nohref="" />
<area shape="rect" coords="36,66,42,52" title="Alaska" nohref="" />
<area shape="rect" coords="151,213,242,169" title="Mexico" nohref="" />
<area shape="rect" coords="111,121,267,4" title="Canada" nohref="" />
<area shape="rect" coords="270,237,354,188" title="Wolfram Knowledgebase with data from © OpenStreetMap contributors: http://www.openstreetmap.org/copyright" nohref="" />
</map>
</p>
The apparent difficulty is that the tooltip active areas in the html file are rectangles and these rectangles were originally regions on the non-flat surface of the earth. Not only that these are mapped back to a gif file. But having done the html corrections we can see that the Canadian rectangle dominates others while on the continent's map and others regions are slightly off (mapped in the ocean):

Brute force attempt:
To bring regions back onto the continent (and while manual editing is going on), I added +50 to both the x-coordinates of the rectangles and I also deleted the other Alaskan island region.
<p class="Output">
 <img src="HTMLFiles/testg1_1.gif" alt="testg1_1.gif" width="420" height="241" style="vertical-align:middle;" usemap="#map_1" />
<map name="map_1">
<area shape="rect" coords="86,100,177,39" title="Alaska" nohref="" />
<area shape="rect" coords="201,213,292,169" title="Mexico" nohref="" />
<area shape="rect" coords="151,121,317,4" title="Canada" nohref="" />
<area shape="rect" coords="270,237,354,188" title="Wolfram Knowledgebase with data from © OpenStreetMap contributors: http://www.openstreetmap.org/copyright" nohref="" />
</map>
</p>
With this change, it becomes usable. The tooltip active area for Mexico behaves better than Alaska/Canada, but slight adjustments can improve it further.

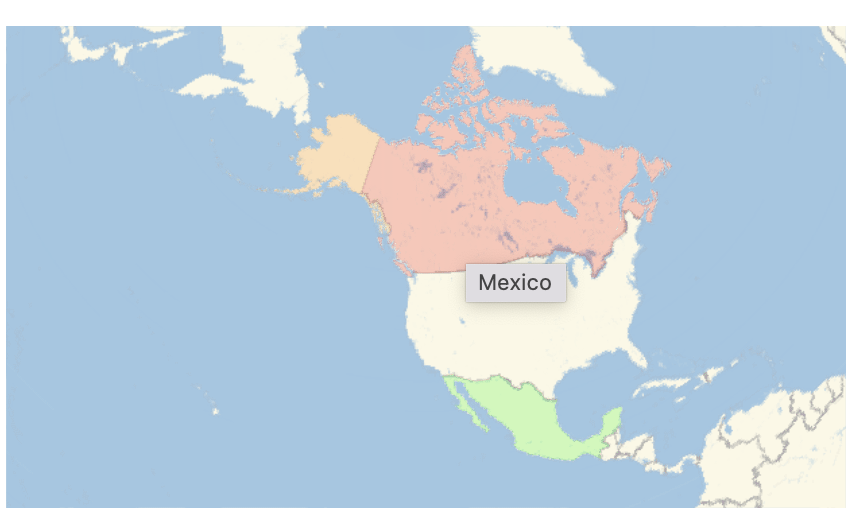
A slightly better solution: where these spurious html entries don't appear is as follows, although the coordinates for rectangles will still have to be shifted manually:
testg1 = GeoGraphics[{
   MapThread[List,
    {{Red, Green, Orange},
     Tooltip[First@#, Last@#,
        TooltipDelay -> 0.3] & /@ {{Entity["Country", "Canada"][
         "Polygon"], "Canada"}
       , {Entity["Country", "Mexico"]["Polygon"], "Mexico"}
       , {Entity[
          "AdministrativeDivision", {"Alaska", "UnitedStates"}][
         "Polygon"], "Alaska"}
       }
     }
    ]

   }]

Export["C:/testg1.html", testg1]
HTML allows circles or polygons to be specified in the area/shape tags; if only, one could find the center and radius for the html output. So I tried to find center of all regions:
Entity["Country", "Canada"]["Polygon"][[1, 1]] //
  Flatten[#, 1] & // Mean
Entity["Country", "Mexico"]["Polygon"][[1, 1]] //
  Flatten[#, 1] & // Mean
Entity["AdministrativeDivision", {"Alaska", "UnitedStates"}][
    "Polygon"][[1, 1]] // Flatten[#, 1] & // Mean
{64.0991, -87.3058}
{22.829, -101.132}
{58.7123, -143.21}
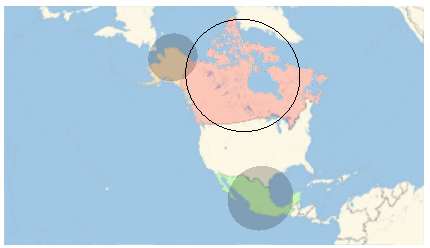
Tried the following variation (after experimenting with placement/radii of disks) where I wanted to draw hidden circles/disks with opacity[0] and assign tooltips to these objects hoping that these objects would translate properly to directives in the html, but the attempt didn't work. The Tooltip command still generates <area... rect..> directives. (not to mention the disappointment caused by the reappearance of those spurious entries in the html)
testalt = GeoGraphics[{
   MapThread[List,
    {{Red, Green, Orange},
     {{Entity["Country", "Canada"]["Polygon"]}
      , {Entity["Country", "Mexico"]["Polygon"]}
      , {Entity["AdministrativeDivision", {"Alaska", "UnitedStates"}][
        "Polygon"]}
      }
     }
    ]
   , Opacity[1],
   Tooltip[GeoCircle[{64.09914123502328`, -95.30576612765371`},
     Quantity[2100, "Kilometers"]], "Canada"]
   , Tooltip[
    GeoDisk[{67.712308848427405`, -155.20968904994098`},
     Quantity[900, "Kilometers"]], "Alaska"]
   , Tooltip[
    GeoDisk[{22.828990946966208`, -101.13221324045072`},
     Quantity[1200, "Kilometers"]], "Mexico"]
   }]

Conclusion: Tooltip mapping from Geo* regions to HTML has room for improvement. If there is an available upgrade in v13.0, I don't know about it as I am using v12.2 on Win7.


